
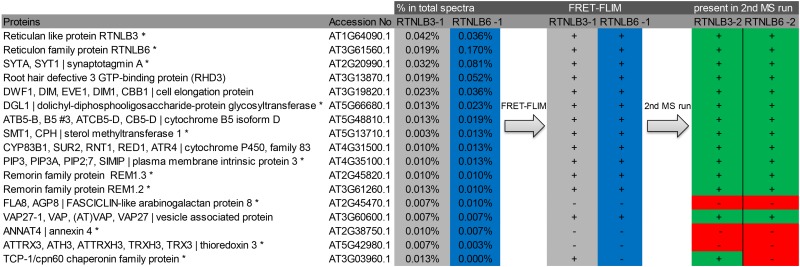
Table II. Flow chart of the 17 proteins tested by FRET-FLIM.
The protein description (column 1) and accession number (column 2) indicate the percentage abundance in the total spectrum for RTNLB3 (column 3) and RTNLB6 (column 4). Proteins present in the PD proteome (Fernandez-Calvino et al., 2011) are marked with asterisks. Positive (+) and negative (−) results for interaction in the FRET-FLIM analysis with either RTNLB3 (column 5) or RTNLB6 (column 6) are shown. The reappearance of the corresponding protein in the second MS run is shown (RTNLB3-2 and RTNLB6-2; columns 7 and 8).
 |