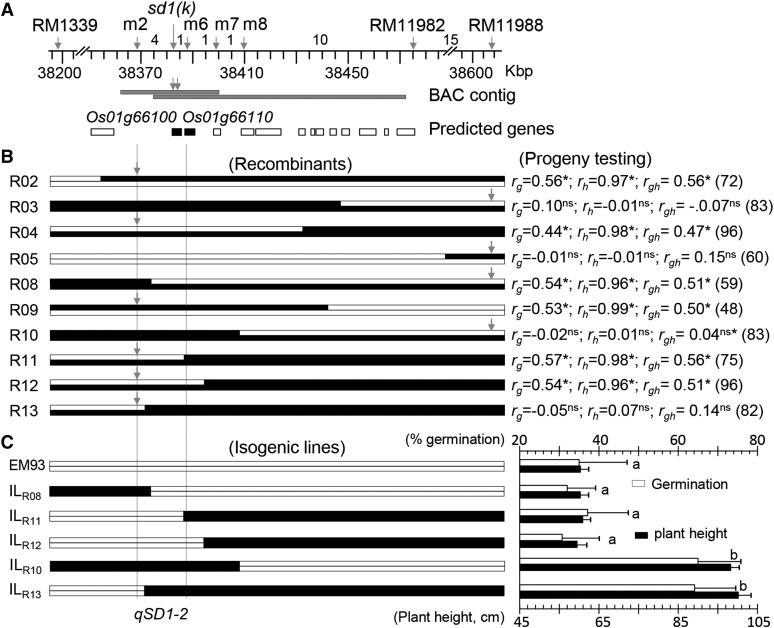
Figure 1.
Fine-mapping of qSD1-2. A, Partial high-resolution map. Arrows indicate marker positions on the reference genome (Kawahara et al., 2013). Figures between markers are numbers of recombinant events identified from 5,184 gametes. Horizontal bars below the map are a bacterial artificial chromosome (BAC) contig screened using the probes (arrows). Boxes below the contig are predicted genes on the reference genome, and genes in the narrowed QTL region are depicted by black color. B, Recombinants and progeny testing. Recombinants (R numbers) for the QTL-containing region are represented by two alleles (chromosomal segments) from SS18-2 (black bars) and/or EM93-1 (white bars). Arrows indicate markers used to genotype the progeny lines. At right, correlation coefficients between marker genotypes and trait values for germination (rg) or plant height (rh) in the lines of n plants are shown. Superscripts indicate the correlations significant at P < 0.001 (*) or not significant (ns). Vertical dotted lines delimit the narrowed qSD1-2 region. Additional statistical and genetic parameters for the lines are listed in Supplemental Table S2. C, Genotypic differences in seed dormancy and plant height among isogenic lines. The isogenic lines were selected from the progeny lines. At right, genotypic means ± sd of 20 to 24 plants for germination (%) and plant height (cm) are shown. The letters a and b indicate results from Duncan’s multiple comparison test for not significant (same letter) and significant (different letter) at P < 0.0001.

