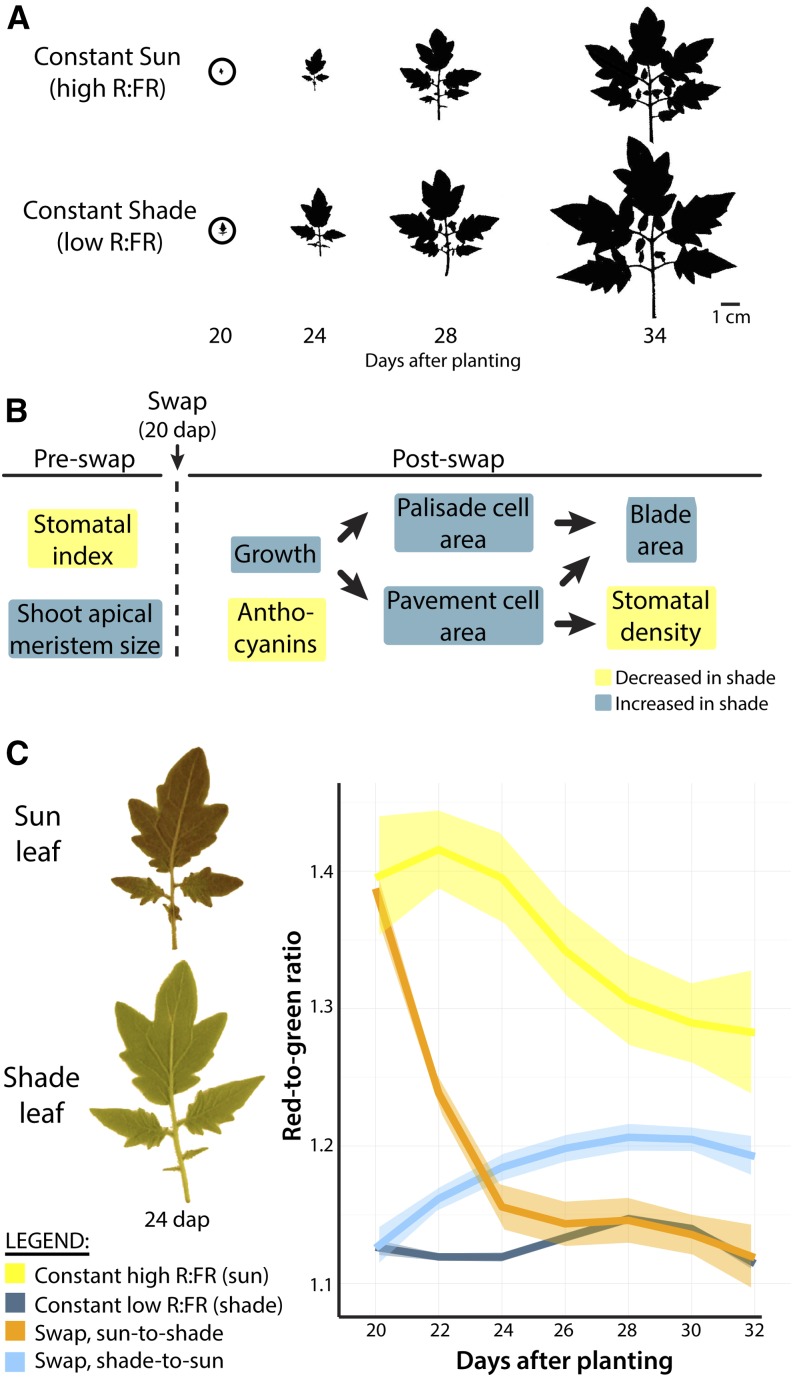
Figure 3.
Swap experiments resolve the shade-avoidance responses before and after laminar expansion. A, Outlines of leaf 2, in constant simulated sun (high R:FR) and constant simulated shade (low R:FR) treatments, show the exponential increases in growth that occur between 20 and 34 DAP, during which traits were recorded. In swapped light conditions, plants are swapped into different light treatments at 20 DAP, at the onset of laminar expansion in leaf 2. B, Traits specified preswap and postswap. Arrows indicate the developmental progression of traits: that is, the effects of one trait (e.g. cell expansion) on subsequent traits (e.g. blade area and stomatal density). Yellow indicates decreased trait values upon swap to shade, and dark blue indicates increased values. C, Red-to-green ratio in leaves is influenced by shade 20 DAP. Sun leaves swapped into shade can dissipate anthocyanins such that levels comparable to constant shade plants are attained. Transparent bands indicate 95% confidence intervals of Loess regression. Yellow, constant sun; dark blue, constant shade; orange, sun-to-shade swap; cyan, shade-to-sun swap.

