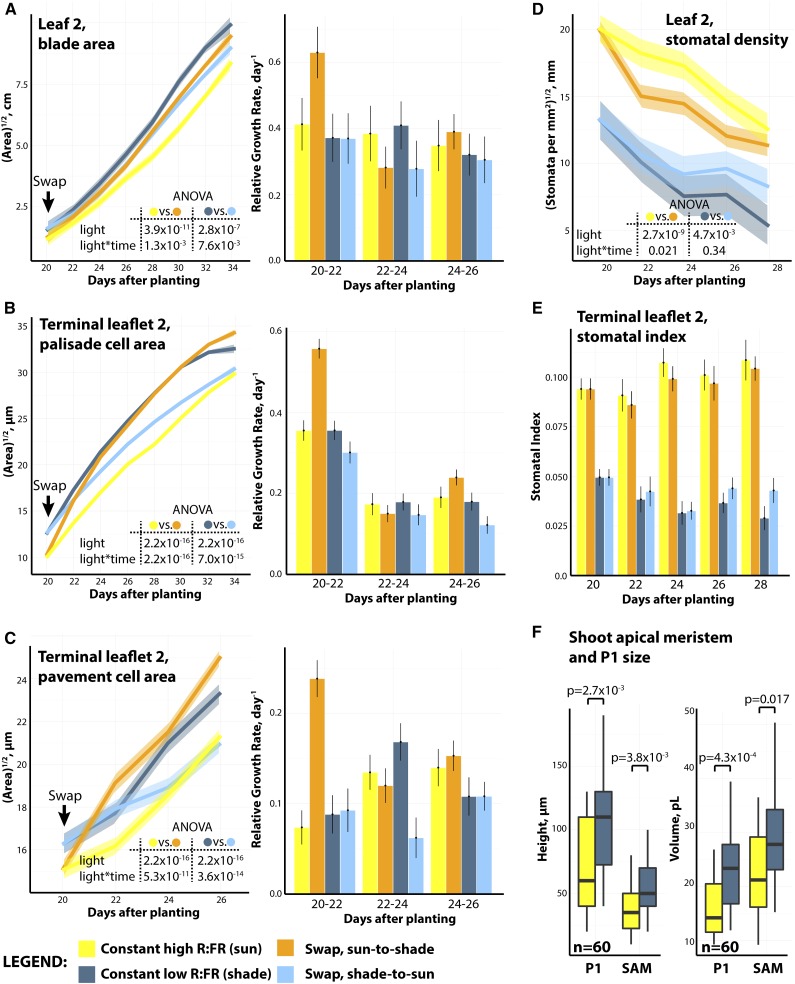
Figure 4.
Shade avoidance is characterized by rapid increases in relative growth rate upon acute shade exposure. A to C, Swap results for leaf 2 overall blade area (A), palisade cell area (B), and pavement cell area (C). Indicated for each trait are P values for factors from fitted ANOVA models comparing constant sun with sun-to-shade treatments and constant shade with shade-to-sun treatments. For each trait, relative growth rates for each condition over 2-d intervals are shown. D and E, Swap results for leaf 2 stomatal traits: absolute stomatal density (D) and stomatal index (patterning) from the terminal leaflet (E). F, Increases in P1 and SAM height and volume as measured from reconstructed histological sections. P values indicate significant differences between constant sun and shade treatments for each trait measured. Transparent bands indicate 95% confidence intervals of Loess regression. Yellow, constant sun; dark blue, constant shade; orange, sun-to-shade swap; cyan, shade-to-sun swap.

