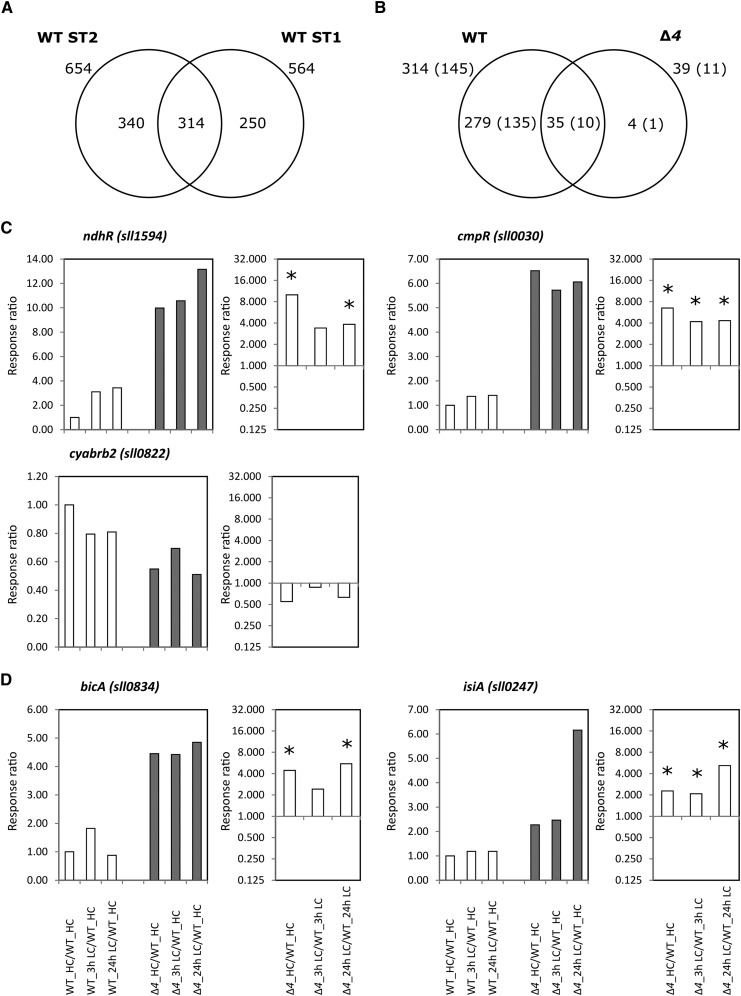
Figure 7.
Transcriptomic responses of the wild type (WT) and the ∆4 mutant to a shift from HC to LC supply. A, Venn diagram of common and specific transcriptome changes upon shifting from HC to LC supply comparing wild-type samples of this study (ST1) with those of an independent previous study (ST2; Klähn et al., 2015). B, Venn diagram of common and specific transcriptome changes upon a shift from HC to LC supply comparing the robustly changed transcripts of the wild type (compare with the intersection of A) with the significant transcript changes in the ∆4 mutant. Numbers of coding mRNAs among these transcripts are given in parentheses, and additional numbers include all transcripts. Note that the single mRNA that is specifically responsive to the shift from HC to LC supply in the ∆4 mutant codes for isiA (compare with D). C, Changes in transcripts for transcriptional regulators of Ci utilization in the ∆4 mutant compared with the wild type. D, Changes in transcripts of the only remaining Ci-uptake system of ∆4, bicA, and the single mRNA that is specifically changed in the ∆4 mutant upon a shift from HC to LC supply in the ∆4 mutant compared with the wild type. Response ratios in the left part of each pair are all calculated relative to the transcript levels of the wild type under HC conditions (WT_HC/WT_HC = 1). Response ratios in the right part of each pair represent the expression of the ∆4 mutant divided by the expression of the wild type under the same conditions and at the same time points. Significant changes (P < 0.05, Student’s t test) are indicated by asterisks.

