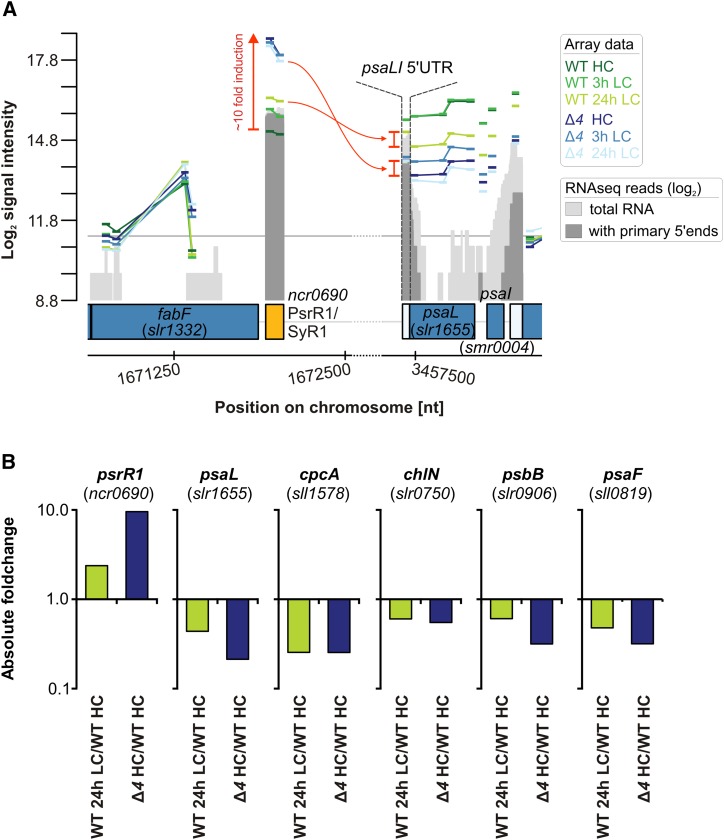
Figure 8.
Posttranscriptional regulon of the sRNA PsrR1. A, Graphical overview of array signal intensities mapped along the genomic loci of PsrR1 and its main target psaL. The color-coded bars represent signals derived from individual microarray probes. The signal intensities on the y axis are given as log2 values. Protein-coding genes are represented by blue boxes, and sRNA-coding regions are represented by yellow boxes. All probes for the same RNA feature are connected by lines. The gray graphs represent RNA sequencing data given as log2 read numbers, which were extracted from Mitschke et al. (2011). nt, Nucleotides. B, Absolute changes in PsrR1 abundance and its verified target mRNAs, psaL, cpcA, chlN, psbB, and psaF, in the ∆4 mutant under HC conditions and in wild-type (WT) cells shifted to LC conditions for 24 h (fold changes relative to wild-type levels under HC conditions = 1).

