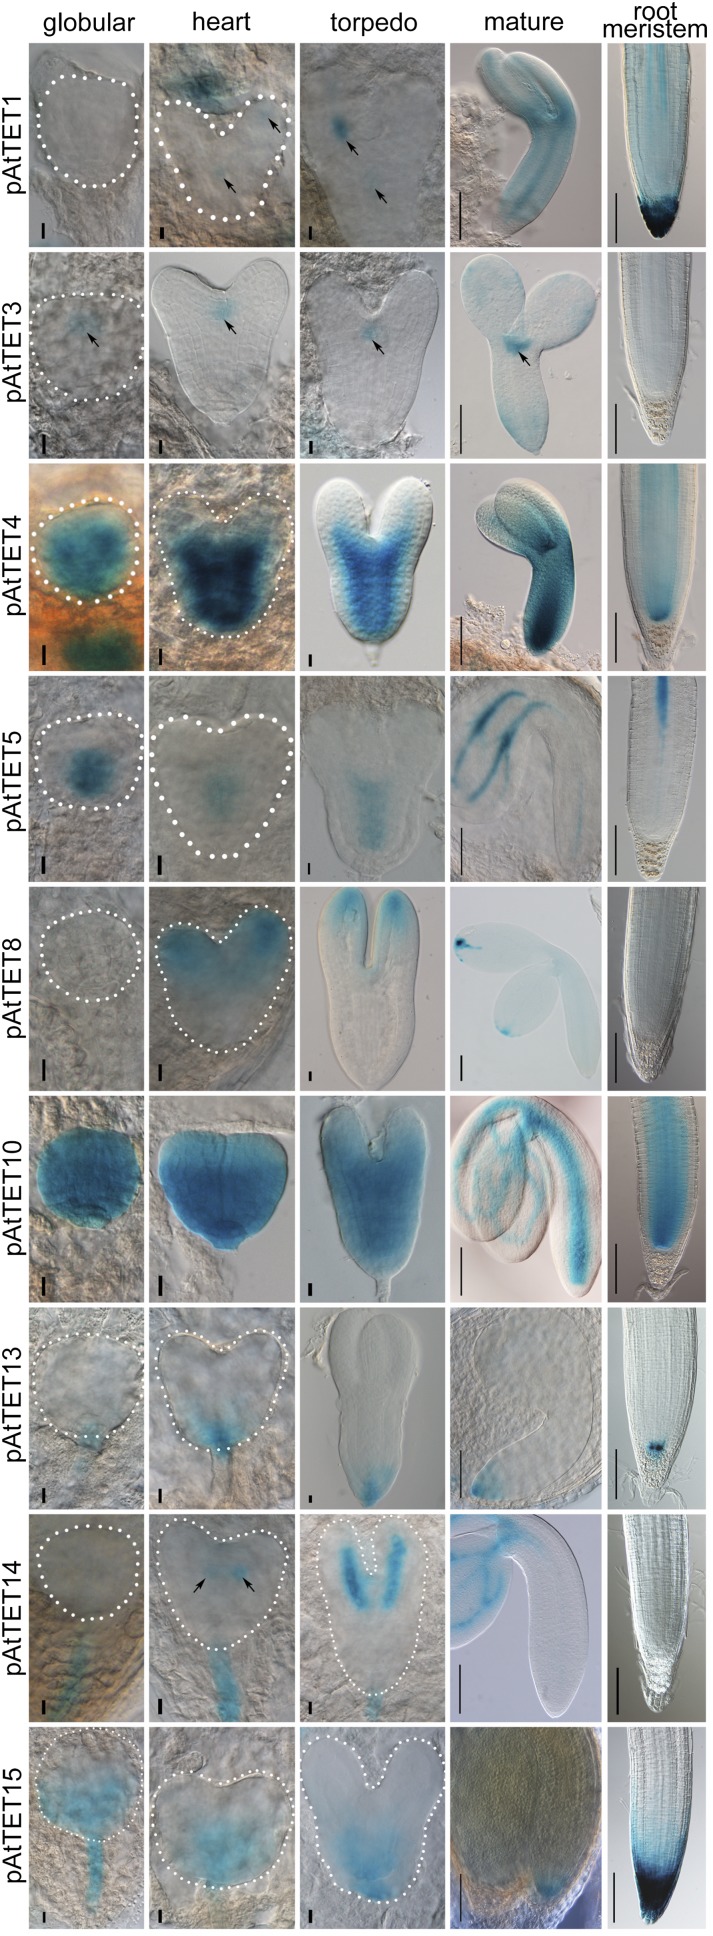
Figure 2.
TET expression patterns during embryogenesis and in the primary root meristem after germination. Transgenic plants shown are as follows: pAtTET1::NLS-GFP/GUS, pAtTET3::NLS-GFP/GUS, pAtTET4::NLS-GFP/GUS, pAtTET5::NLS-GFP/GUS, pAtTET8::NLS-GFP/GUS, pAtTET10::NLS-GFP/GUS, pAtTET13::NLS-GFP/GUS, pAtTET14::NLS-GFP/GUS, and pAtTET15::NLS-GFP/GUS. Columns represent consecutive developmental stages: globular, heart, torpedo, and mature. Dotted lines delineate the outlines of the young embryos. Arrows in TET1, TET3, and TET14 images indicate gene expression sites. Bars = 0.01 mm (globular, heart, and torpedo stages) and 0.1 mm (mature embryo and root meristem).

