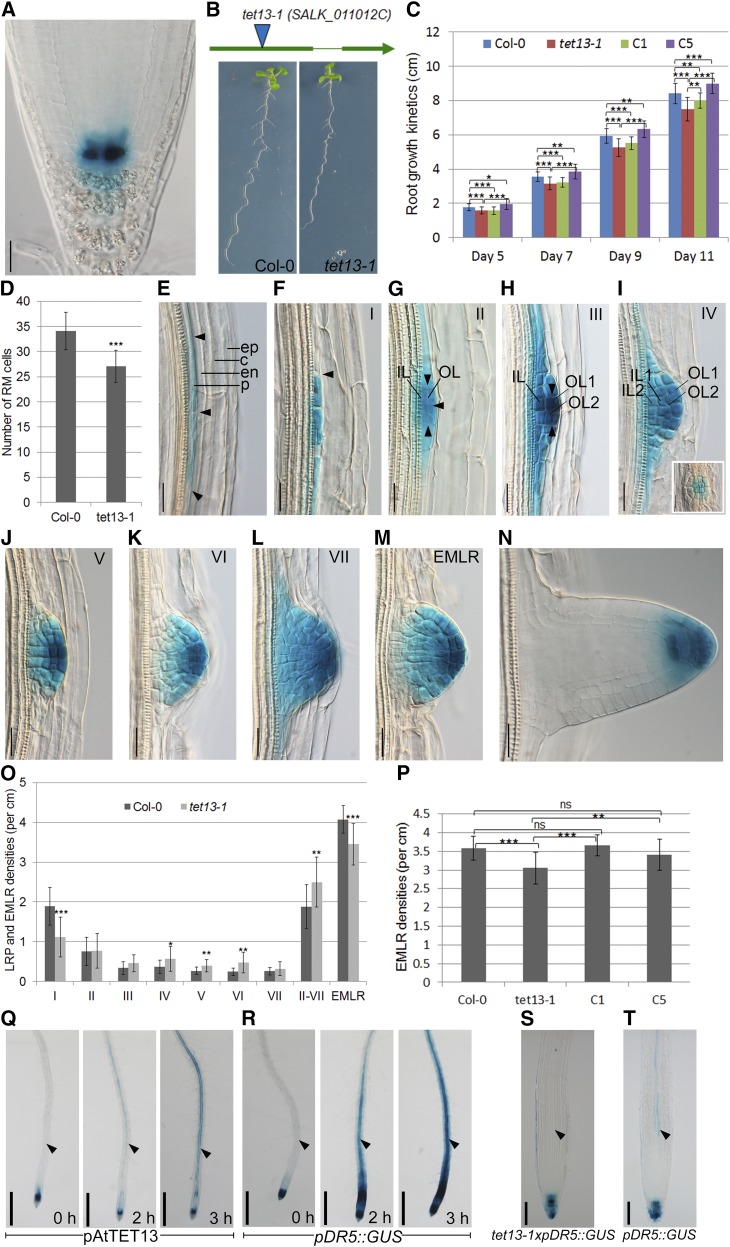
Figure 4.
TET13 expression in the primary root and LRP, tet13-1 root phenotypes, and complementation. Transgenic plants shown are as follows: pAtTET13::NLS-GFP/GUS (A, E–N, and Q), tet13-1 (B–D, O, and P), C1 and C5 (tet13-1 containing one and two T-DNA loci with p35S::TET13; C and P), pDR5::GUS (R and T), and tet13-1 × pDR5::GUS (S). A, TET13 expression in the primary root tip. B, tet13-1 scheme and 12-d-old seedlings of Columbia-0 (Col-0) and tet13-1 growing vertically under the 24-h light condition. C, Primary root growth kinetics. Means ± sd are presented (n = 22–33). Asterisks mark significant differences: *, P < 0.05; **, P < 0.01; and ***, P < 0.001. D, Root meristem size (defined as the number of root meristem [RM] cells) of 6-d-old seedlings. Means ± sd are presented (n = 28–39). E to N, Detailed expression analysis of TET13 at different stages during lateral root development. Corresponding developmental stages I to VII and emerged lateral root (EMLR) are indicated in the top right corner. IL and OL, Inner and outer layers, respectively; c, cortex; en, endodermis; ep, epidermis; p, pericycle. Arrowheads indicate the division planes. The inset in I shows the top view of stage IV. O, Staging of LRP and EMLR densities. Means ± sd are presented (n = 20). P, EMLR densities. Means ± sd are presented (n = 22–33). ns, Not significant. Asterisks mark significant differences: *, P < 0.05; **, P < 0.01; and ***, P < 0.001. Q and R, NAA-induced TET13 (Q) and pDR5::GUS (R) expression. The seedlings were grown on 10 µm NPA medium for 72 h after germination and then transferred to 10 µm NAA medium for 0, 2, and 3 h. S and T, DR5::GUS expression patterns at the root basal meristem in 7-d-old tet13-1 × pDR5::GUS (S) and wild-type (T) seedlings. In Q to T, black arrowheads indicate sites of inducible expression. Bars = 0.01 mm (E–N), 0.1 mm (S and T), and 0.5 mm (Q and R).

