Figure 5.
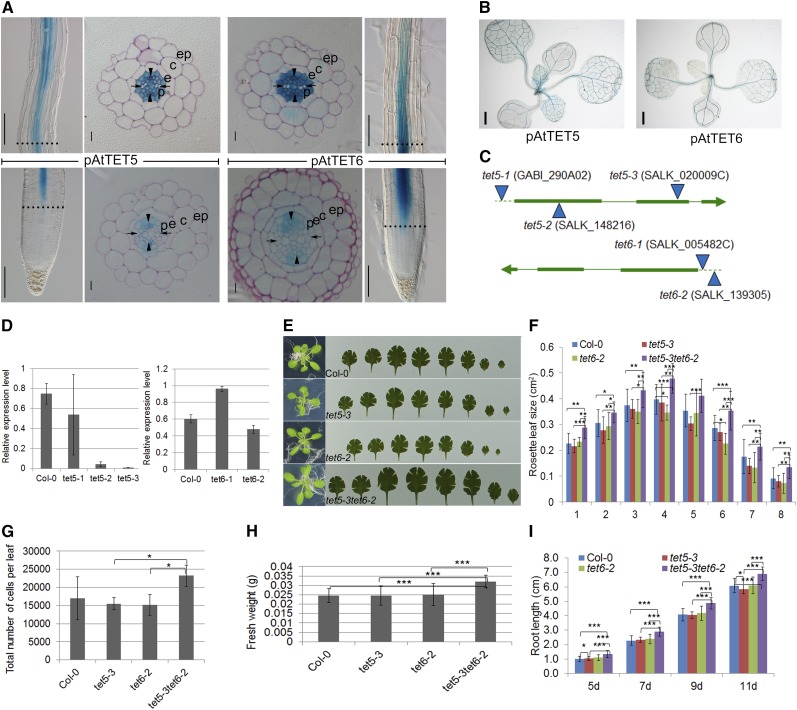
TET5 and TET6 expression, and tet5-3, tet6-2, and tet5-3tet6-2 mutant phenotypes. Transgenic plants shown are as follows: pAtTET5::NLS-GFP/GUS (A and B), pAtTET6::NLS-GFP/GUS (A and B), tet5-3 (C–I), tet6-2 (C–I), and tet5-3tet6-2 (E–I). A, TET5 and TET6 expression in the vascular tissue of the meristem-elongation transition zone (between dashed lines) and the differentiation zone (top) of the primary root, of which part of the elongation zone is omitted; the root tip (lower images) and the differentiation zone (upper images) are shown. Transverse sections show the transition zone and differentiation zone, as indicated by the dashed lines. c, Cortex; e, endodermis; ep, epidermis; p, pericycle. Arrowheads and arrows indicate phloem pole and protoxylem, respectively. B, TET5 and TET6 expression in the rosette leaves. C, TET5 and TET6 schemes with T-DNA insertions. Thick, thin, and broken lines indicate exons, introns, and promoter, respectively. D, Relative TET5 (right) and TET6 (left) transcript levels in 7-d-old seedlings measured by quantitative reverse transcription-PCR. Means ± sd are presented (n = 3). E, Rosette and leaf series of 21-d-old seedlings. From left to right are leaf 1 to leaf 8; incisions were made to make the leaves fully expanded when necessary. F, Quantification of the rosette leaf sizes in E. Means ± sd are presented (n = 8–10). G, Total number of cells per leaf. Leaf 1 and/or 2 were used. Means ± sd are presented (n = 3). H, Fresh weight of 21-d-old seedlings. Only rosette leaves were used for the experiment. I, Primary root growth kinetics (root length). Means ± sd are presented (n = 31–39). Asterisks in all graphs mark significant differences: *, P < 0.05; **, P < 0.01; and ***, P < 0.001. Bars = 0.01 mm (A, transverse section), 0.1 mm (A, longitudinal section), and 1 mm (B).

