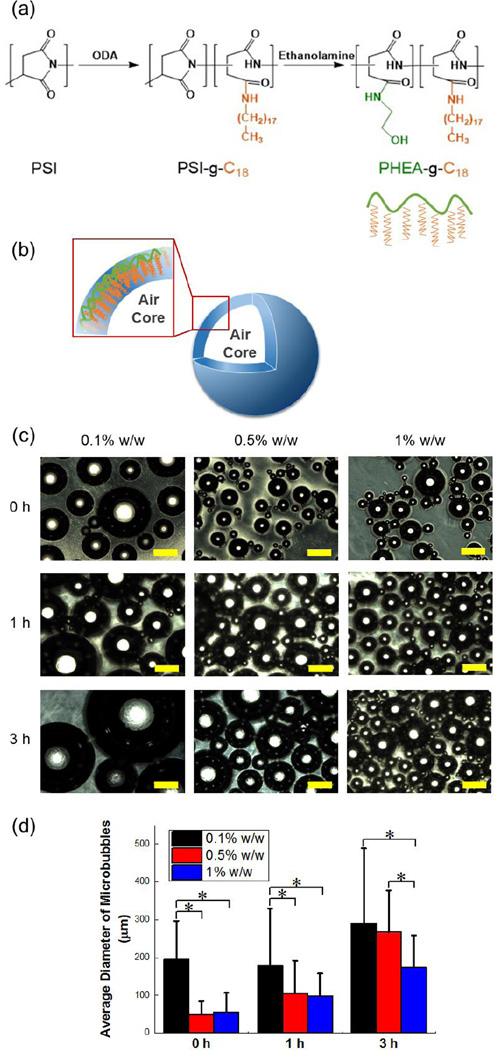
Figure 1.
Synthesis and characterization of PHEA-g-C18 microbubbles. (a) The reaction scheme to synthesize PHEA-g-C18. (b) The schematic microstructure of the microbubble formed via self-assembly of PHEA-g-C18. (c) Optical microscopy images of microbubbles prepared with solution of three different PHEA-g-C18 concentrations. The bubbles were captured at different time points while being incubated in deionized water at 37 °C. Scale bars represent 200 µm. (d) The size growth of microbubbles prepared with 0.1, 0.5, and 1% w/w PHEA-g-C18 solutions over 3 hours. The values and error bars in (d) represent average values and standard deviation of more than 50 microbubbles per condition respectively. * represents the statistical significance of the values between conditions (* p<0.05).

