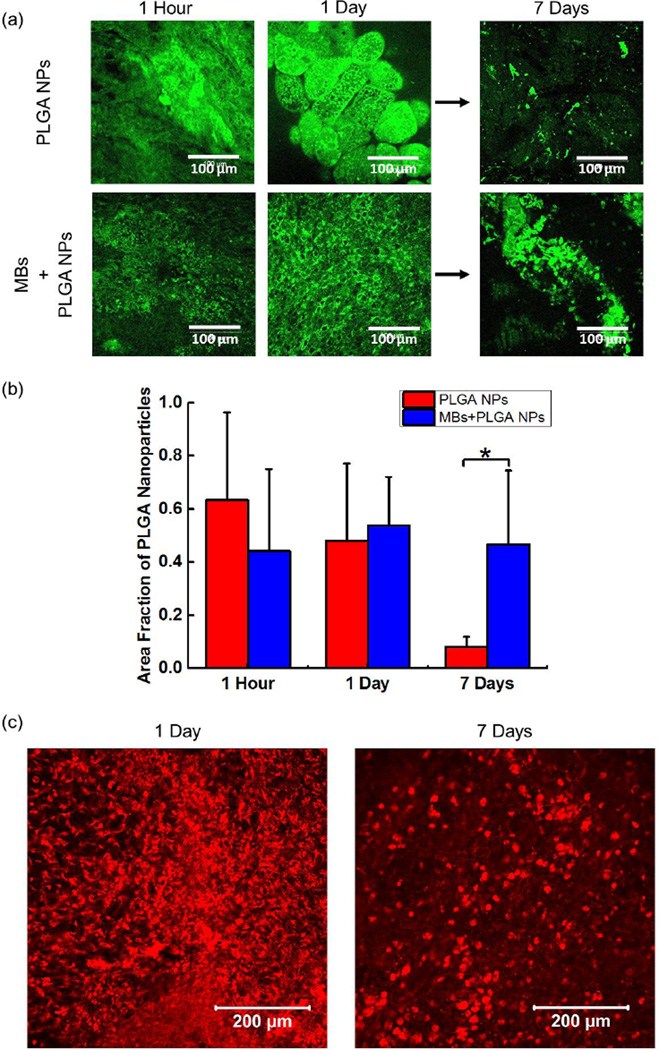
Figure 3.
In vivo evaluation of PLGA nanoparticle (NP) retention. (a) The confocal microscopy images of CAMs implanted with FITC-labeled PLGA NPs with and without microbubbles (MBs) at different time points. (b) The quantified fraction of PLGA NPs remained on the implantation site. The values and error bars represent average value and standard deviation of 9 samples per condition, respectively. (c) The confocal microscopy images of CAM implanted with rhodamine B labeled PHEA-g-C18 MBs at different time points. * represents the statistical significance of the values between conditions (* p < 0.05).

