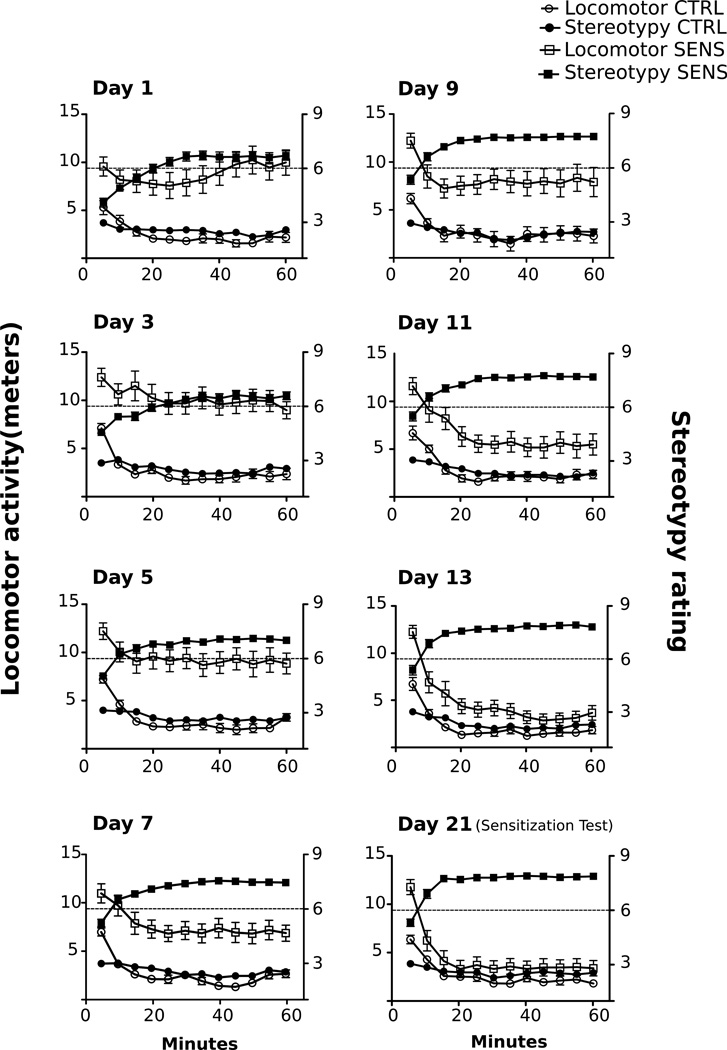
Fig. 4.
Locomotor activity and stereotypy (shown in 5 min bins for a total of 60 min) in animals injected repeatedly with MA (n = 20) or SAL (n = 19) on Days 1–21 (data from experiments 3 & 4). M. Correlation values for the SENS group can be found in Table 1. All data are depicted as mean ± SEM.

