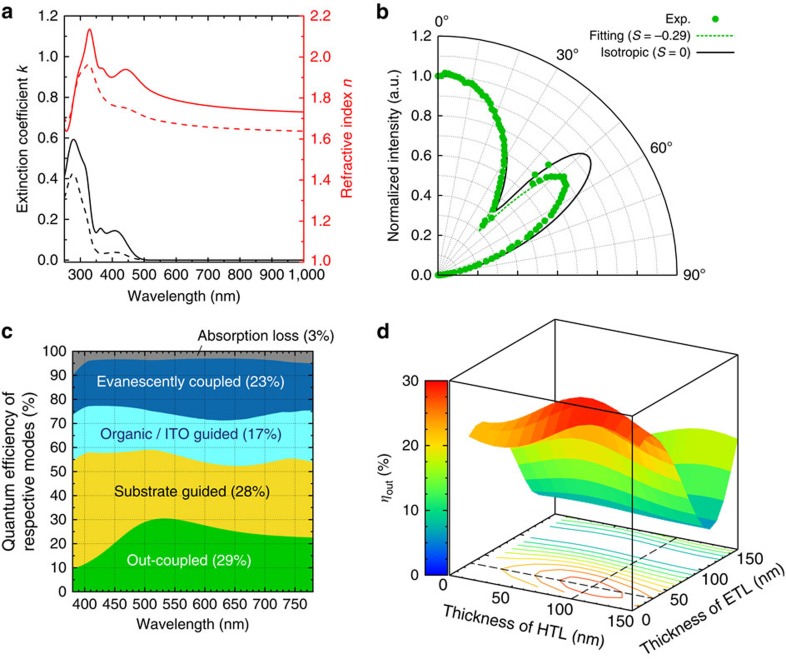
Figure 4. Orientation of transition dipole moment and out-coupling.
(a) Results of VASE measurements; extinction coefficient k (black) and refractive index n (red). The solid and dashed lines represent spectra for the ordinary and extraordinary optical constants, respectively. (b) Results of angular-dependent PL experiments. (c) Optical simulations for the DACT-II-9 device. The numbers in parentheses for respective modes are obtained by the integration with respect to emission wavelengths with weighting of the PL intensity. (d) Dependence of the out-coupling mode on the thicknesses of hole and electron-transport layers.

