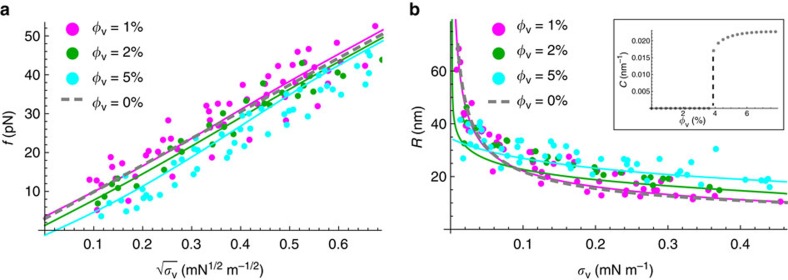
Figure 3. Mechanical effect of I-BAR binding to the inner leaflet of membrane tubes.
(a) Pulling force, f, as a function of the square root of tension,  , for three different values of φv : 1% (magenta, N=9 GUVs), 2% (green, N=5 GUVs) and 5% (cyan, N=10 GUVs). Fitting yields (see Supplementary Note 1 for details) an average value of the protein-membrane elastic parameter
  =(32±12) kBT. The dashed line corresponds to a fit to the data obtained for bare GUVs (Supplementary Fig. 5a). (b) Tube radius, R, as a function of σv, for the same conditions as in (a). Fitting yields
  =(60±30) kBT. The dashed line corresponds to a fit to the data obtained for bare GUVs (Supplementary Fig. 5b). Data and fit for φv=5% indicate that R extrapolates to a finite value at zero tension, whereas for φv=1 and 2% it diverges. Inset shows calculated jump in tube curvature (1/R) at zero tension as a function of φv.

