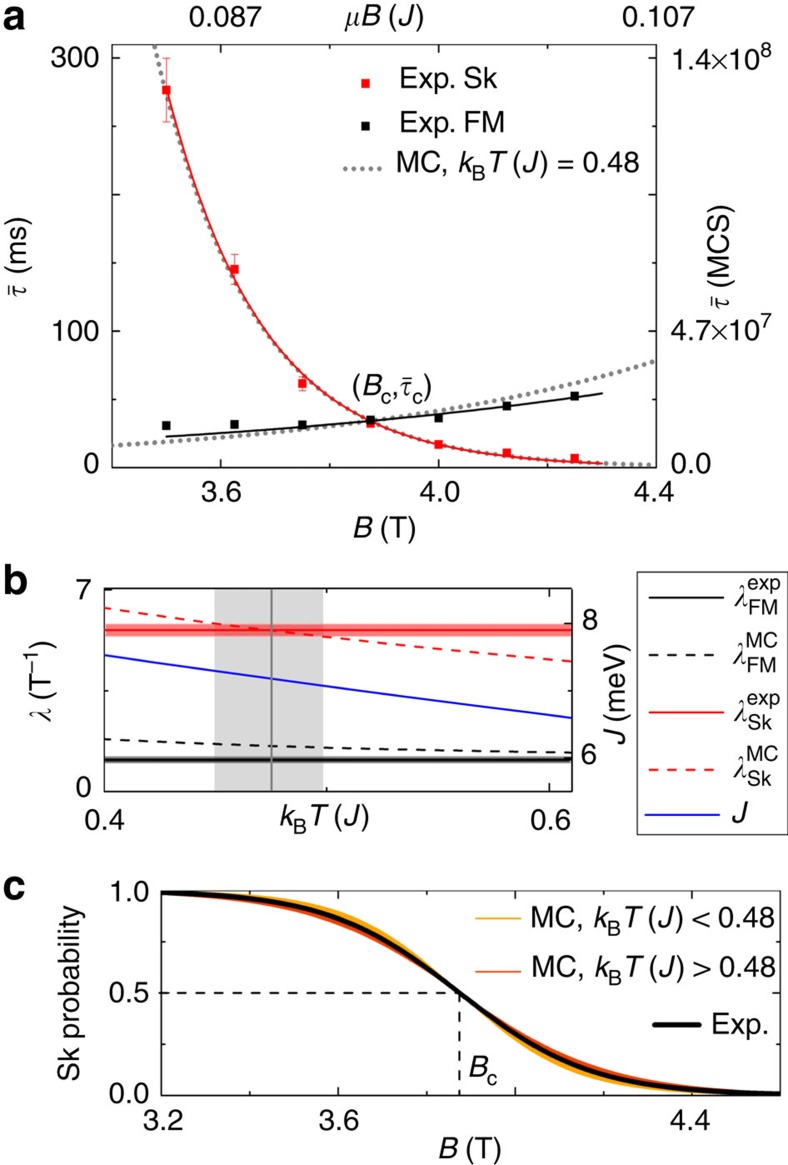
Figure 3. Calibration of MC results with experimental data obtained on Pd/Fe/Ir(111).
(a) The mean lifetimes obtained from experiments on Pd/Fe/Ir(111) as a function of the magnetic field B in combination with mean lifetimes obtained from MC calculations. The MC data are linearly rescaled to the experimental data such that the critical points given by  coincide. The lifetimes are described by exponential functions
  . (b) λFM/Sk for the experimental data (exp) and MC data (MC). The values
  depend on the MC temperature used. The best correspondence between experiment and MC is found using the MC temperature kBT≈0.48 J marked by the vertical grey line. The calibration of the MC mean lifetimes at this temperature with the experimental lifetimes provide an absolute value for the exchange parameter of J=7.1±0.2 meV. (c) The skyrmion probability
  .
.

