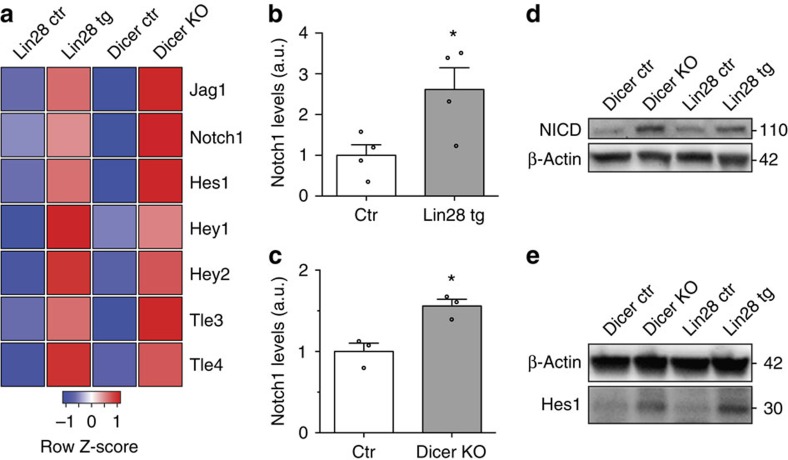
Figure 4. The myelination-inhibiting Notch pathway is hyperactive in Lin28 tg and Dicer KO.
(a) Heatmap representation of significantly (P<0.05) regulated Notch pathway members in sequencing data from PN1 Lin28 tg and Dicer KO versus control SN (n=3 mice per condition). Colour intensities represent the Z-score for each row, red indicating higher expression and blue indicating lower expression. (b,c) Levels of Notch1 mRNA in SN of Lin28 tg and respective controls (n=4 mice per condition) (b) and in Dicer KO and respective controls (n=3 mice per condition) (c) at PN5. (d,e) Immunoblots of NICD (d), Hes1 (e), and β-actin as a loading control, from PN5 SN of Lin28 tg, Dicer KO and their respective controls. Numbers refer to estimated apparent molecular weights (kDa). For quantifications see Supplementary Fig. 3g–j. Error bars: s.e.m. Two-sided two-sample Student's t-test *P<0.05 (b,c).

