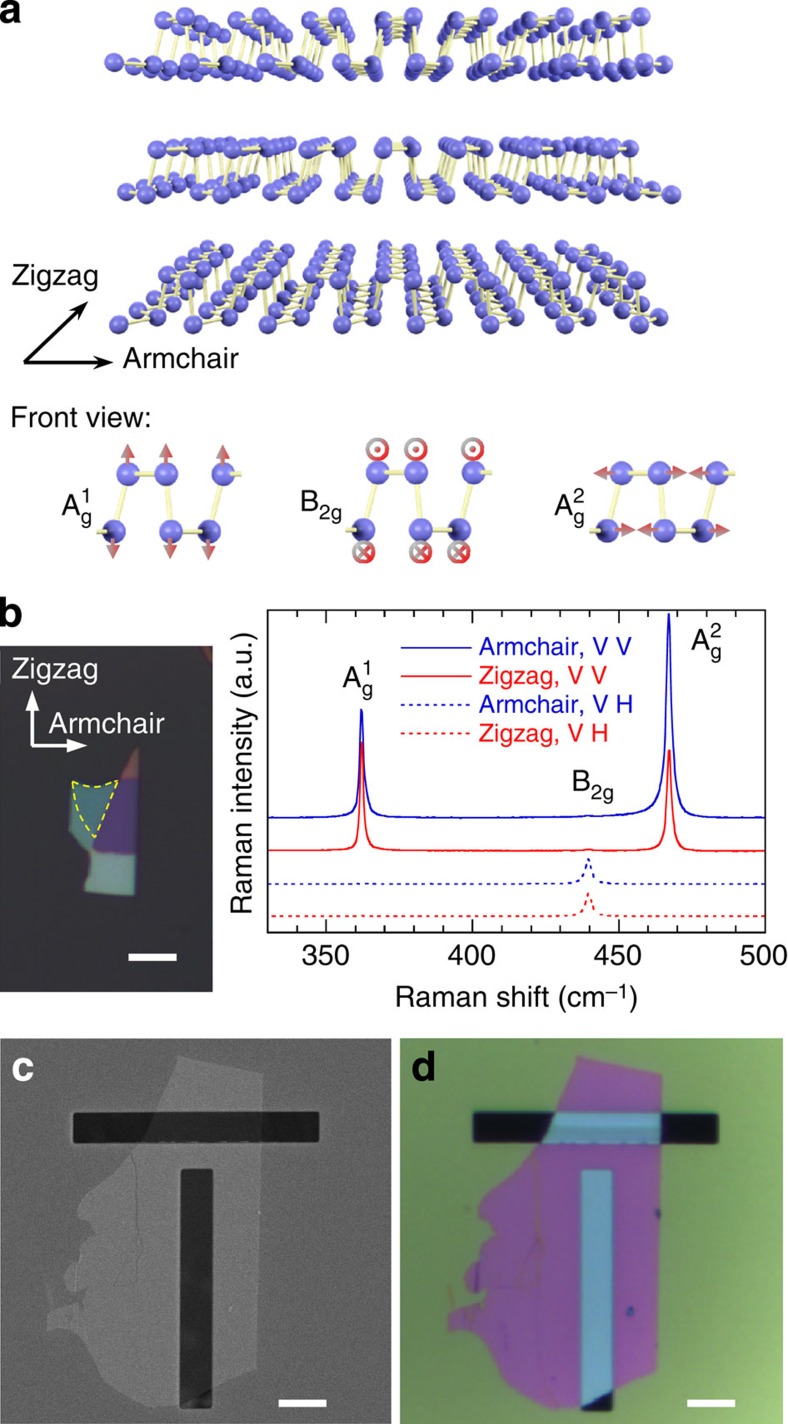
Figure 1. Characterization of black phosphorus flakes.
(a) Lattice structure of BP and atomic vibrational patterns of Ag1, B2g and Ag2 phonon modes. (b) Polarized Raman spectra (right) collected from a BP flake on SiO2/Si substrate (left) showing the ability of polarized Raman technique to distinguish the armchair and zigzag axes. (c) Scanning electron microscopy image and (d) optical image of the 16.1-nm-thick BP flake suspended on slits. Scale bars, 5 μm (all).

