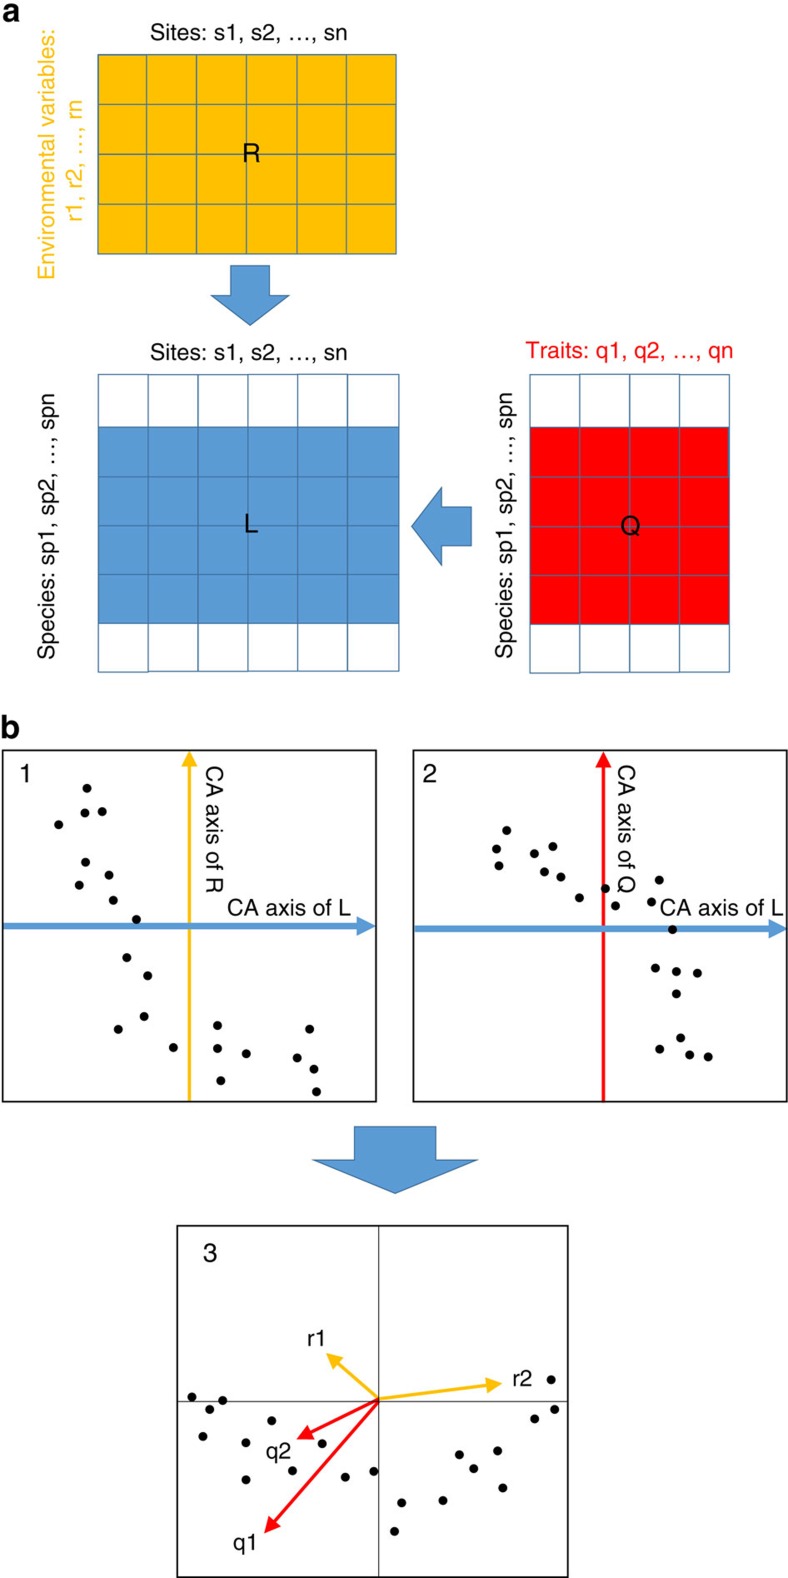
Figure 2. Conceptual overview of the RLQ analysis.
RLQ is a co-inertia analysis that couples multiple data sets and identifies co-relationships between them. The multivariate RLQ analysis relates a species-traits table (Q) to a table of environmental variables at each site (R), using a species-abundances table (L) as a link (a). Correspondence analysis (CA) of the R variables against L (Plot 1) and Q variables against L (Plot 2) can be combined (Plot 3) to show the r-components (environmental variables from Table R) and q-components (species traits from Table Q) as vectors within a single bi-plot (b). Modified with kind permission from Dolédec et al., Figures 1 and 5 (ref. 19).

