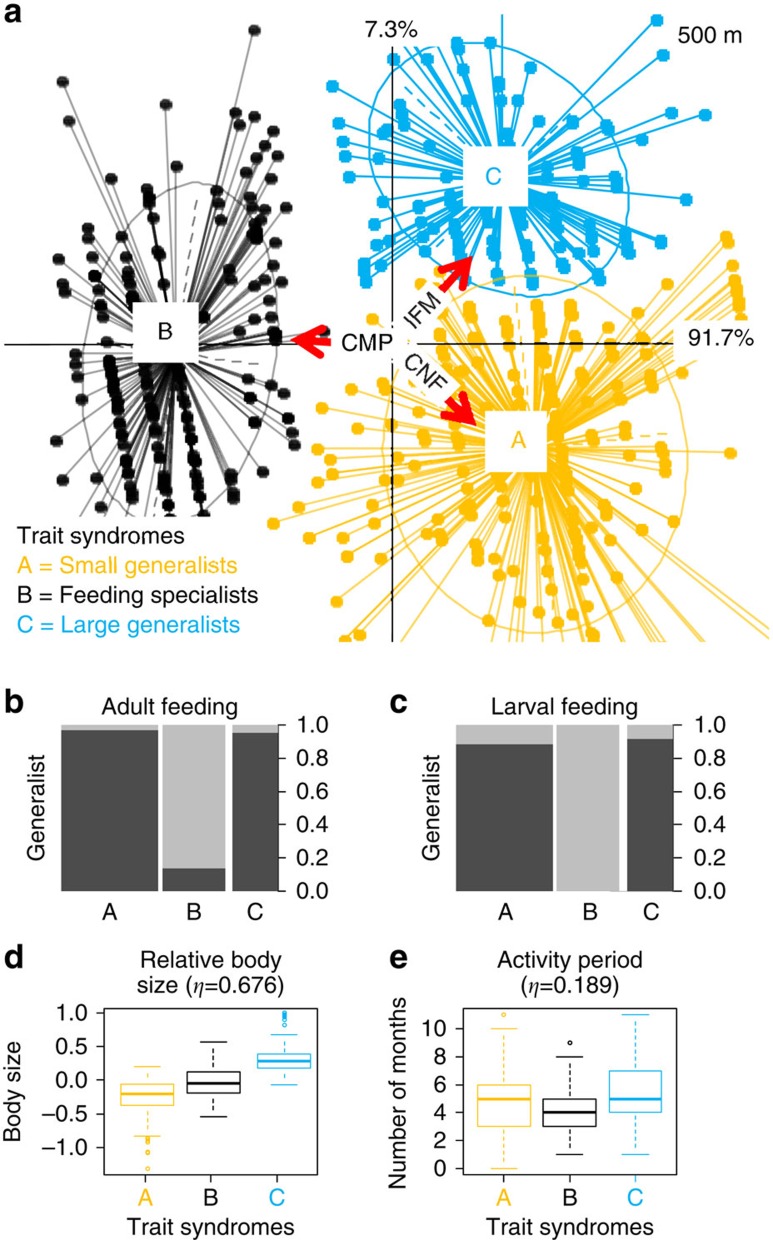
Figure 3. Trait responses to in-field management practices (IFM) and landscape variables (CNF=configurational landscape heterogeneity or patch size and CMP=compositional landscape heterogeneity or diversity of land cover types) within 500 m radius.
RLQ biplot, showing the decomposition of co-correlations between environmental variables (R-Table 3 × 72) and trait attributes (Q-Table 598 × 4), constrained by abundance (L-Table 72 × 598). The size and direction of environmental effects are represented by red arrows. Clustered points identify trait syndrome groups and are represented with the same colour (a). Boxplots represent the distribution of trait attributes (mean, inner-quartile range (IQR) and outliers>1.5 × IQR) in cluster (b–e). The width of the bars represents relative abundance and the black component indicates the proportion of generalist feeders within the whole community: the higher the bar, the greater the proportion (b,c). Note: a has been rescaled for display purposes.

