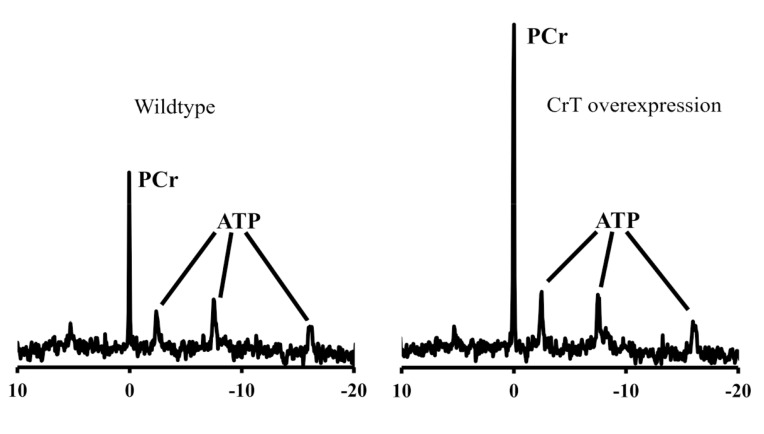
Fig. (3).
31P-NMR spectra from ex vivo Langendorff perfused mouse heart. The left panel is from a wild-type mouse showing a large phosphocreatine (PCr) peak and the three phosphoryl groups of ATP. On the right is a spectrum from a creatine transporter over-expressing mouse (Oxford) heart showing greatly increased PCr peak.

