
Figure 5.
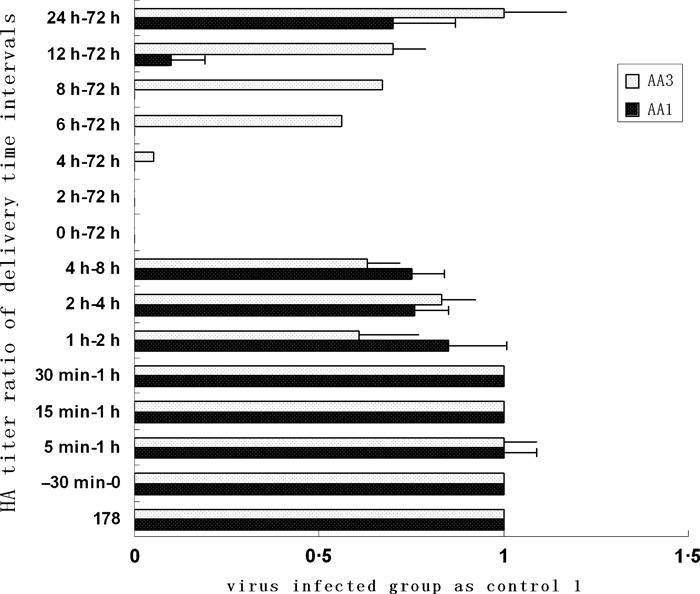
Effect of the time‐of‐addition of AA1:0·52 μm; AA3:4·15 μm, 100 μl at various times during the replication cycle of influenza virus. Time 0 = post 1 h adsorption period at 4°C. Each value represents the mean ± SEM of three separate assays.
Official websites use .gov
A
.gov website belongs to an official
government organization in the United States.
Secure .gov websites use HTTPS
A lock (
) or https:// means you've safely
connected to the .gov website. Share sensitive
information only on official, secure websites.
Effect of the time‐of‐addition of AA1:0·52 μm; AA3:4·15 μm, 100 μl at various times during the replication cycle of influenza virus. Time 0 = post 1 h adsorption period at 4°C. Each value represents the mean ± SEM of three separate assays.