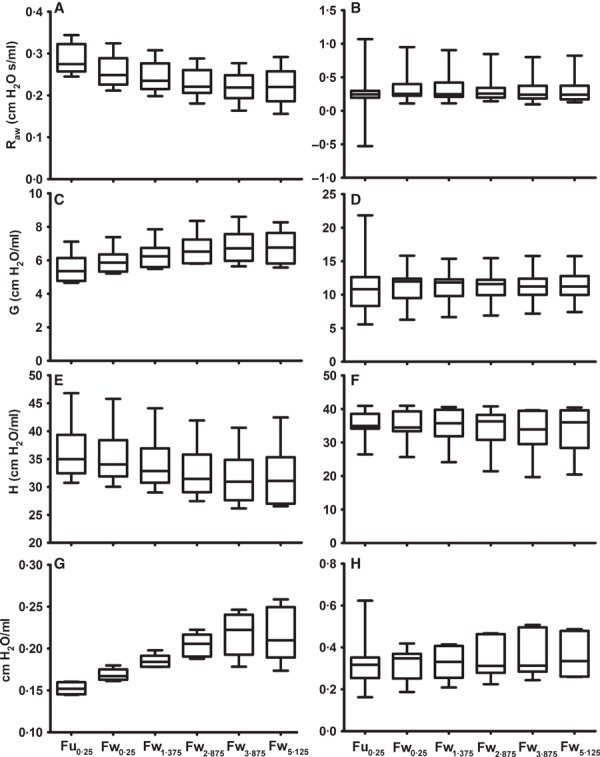
Figure 1.

Box and whisker plots of baseline airway resistance (R aw), tissue damping (G), tissue elastance (H), and hysteresivity (η) of BALB/c mice, 4 days post‐inoculation with influenza A (B, D, F and H) or control solution (A, C, E and G) using different methods of fitting the constant‐phase model to Z rs spectra. Note different scales.
