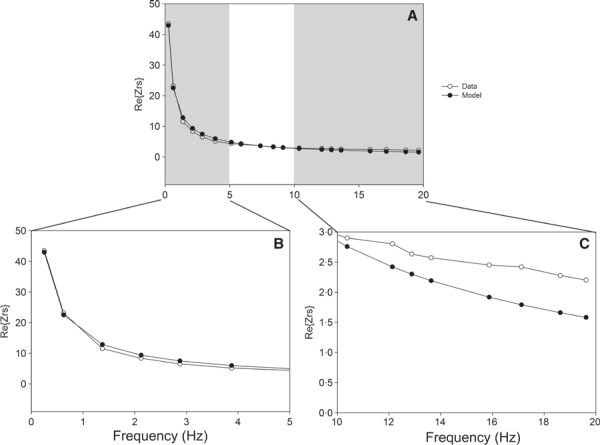
Figure 3.

Representative “real part” of the impedance spectrum and constant‐phase model (CPM) fit for an influenza‐infected mouse after exposure to 30 mg/ml MCh, using the Fu0·25: unweighted fit/0·25–19·625 Hz criterion. Panel A shows the entire Z rs, while panels B and C zoom in on either end of the Z rs. For this individual, R aw = −0.73 cm H2O s/ml, G = 47.25 cm H2O/ml, and H = 90.61 cm H2O/ml. Open circles represent Z rs measured at each frequency, and closed circles represent CPM fit. The data shown in Figure 4 are for the same measurement from the same mouse, using an alternative fit criterion.
