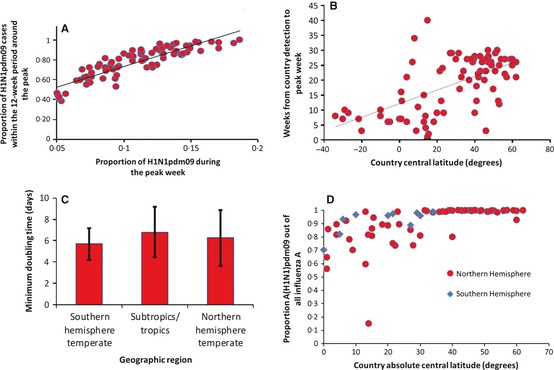
Figure 3.

Correlation between countries' influenza A(H1N1)pdm09 weekly proportion in the peak week (peak activity) and the proportion of cases within the 12‐week period around the peak (A). Correlation between country latitude and number of weeks from country detection of influenza A(H1N1)pdm09 until countries' peak week (B). Mean influenza A(H1N1)pdm09 minimum doubling times by geographical region (C). Correlation between countries' central latitude and the proportion of influenza A(H1N1)pdm09‐positive specimens, out of all influenza A‐positive specimens (D).
