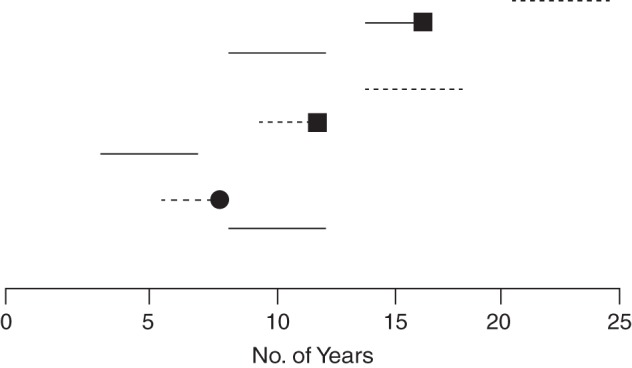
Figure 2.

Illustration of how the observation period of the dynamic (with respect to calendar time) hypothetical population in Figure 1 includes just some of the information from the corresponding fixed (with respect to start of exposure) cohort study in which follow-up would have started with first exposure or the corresponding date in the nonexposed. The time axis is exposure time and starts at initiation of exposure or beginning of follow-up in nonexposed persons (time 0). Solid horizontal lines (—) represent exposed time experienced by a person in a dynamic population; dashed horizontal lines (----) represent unexposed time; black squares (▪) represent incident cases; black circles (•) represent loss to follow-up.
