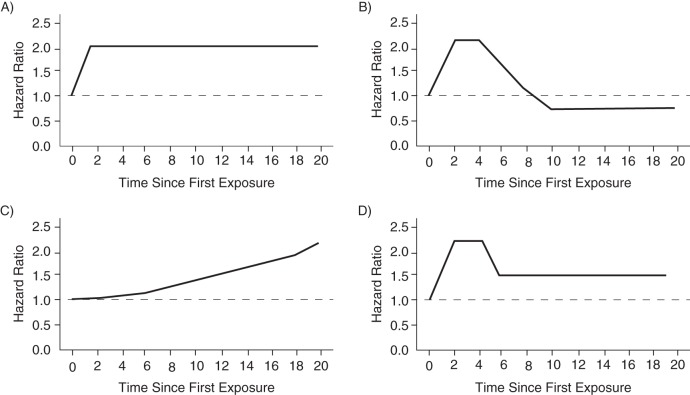
Figure 3.
Some possible patterns of hazard ratios by time since first exposure in a hypothetical population. Time axis is arbitrary and can be minutes, days, months, or years. A) Hazard ratio is constant by time since first exposure (latency period can be short); B) initially increased hazard ratio followed by reduced hazard ratio; C) increasing hazard ratio by time since first exposure; D) initial increase, followed by lower but still elevated hazard ratio.

