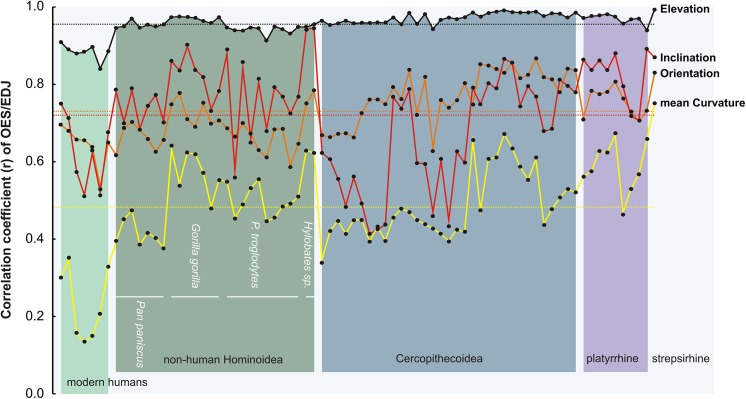
Fig 2. Level of correlation between EDJ and OES for topometrical signifiers within the primate sample.
The correlation coefficient (r) is displayed for elevation (black profile), inclination (red), orientation (orange) and mean curvature (yellow) for each specimen (black dot) Dotted lines correspond to the average correlation level for each topometrical signifier.

