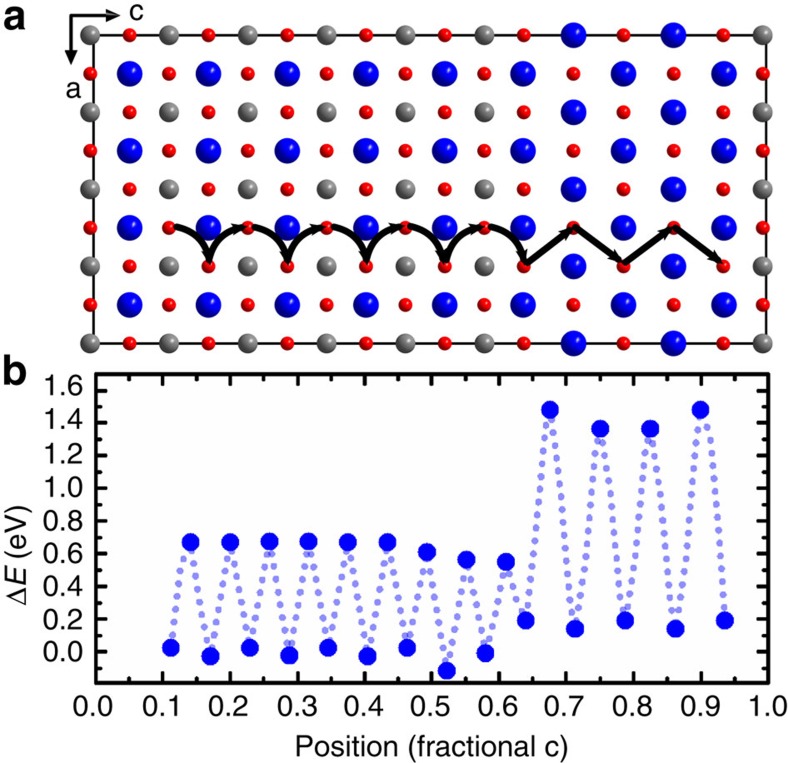
Figure 4. Oxygen-vacancy migration in the SrTiO3/SrO heterostructure.
(a) Illustration of the simulation cell of the heterostructure, with the simulated migration path indicated schematically by black arrows. Sr in blue, Ti in grey and O in red. (b) Energies of the sites and saddle points corresponding to an oxygen vacancy migrating through the heterostructure. The x axis is scaled to the fractional coordinates of the c axis of the simulation cell. All plotted energies are referenced to the average vacancy formation in the SrTiO3 regime of the simulation cell. The dotted line serves as a guide to the eye for the change in energy during the migration process.

