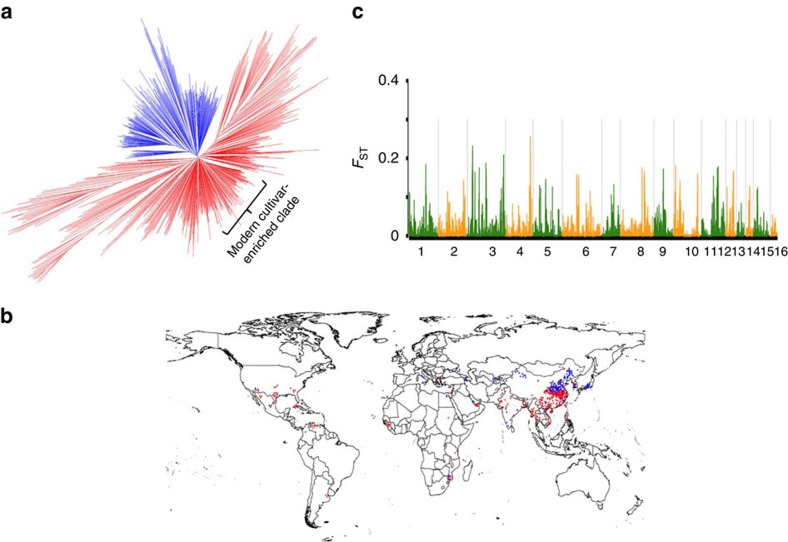
Figure 1. Phylogenetic tree and geographic distributions of 705 sesame varieties.
(a) Neighbour-joining tree of all the varieties calculated from whole-genome SNPs. The two recognizable groups are coloured in red and blue, respectively. (b) Geographic distributions of all the varieties are indicated as spots in the world map, with the two groups colour coded as in a. (c) The level of genetic differentiation (FST) between the two groups is plotted against the whole genome.

