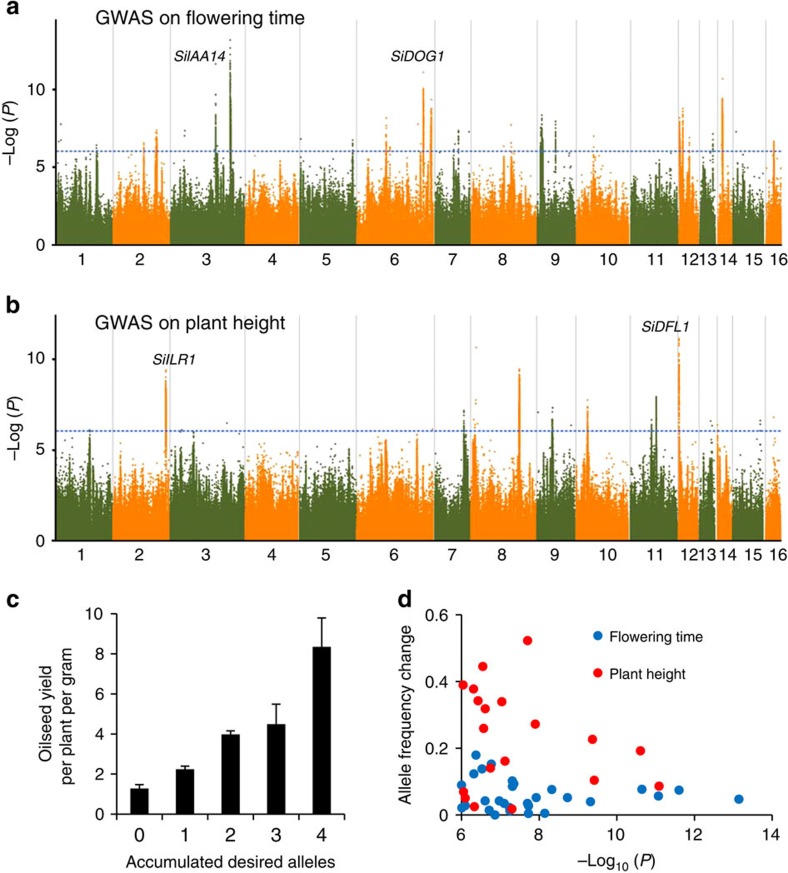
Figure 6. Genetic analysis of flowering time and plant height for oilseed yield.
(a) Negative log10 P-values for association of flowering time in Sanya (Y axis) are plotted against SNP positions (X axis). Two loci (SiDOG1 and SiIAA14) significantly associated with oilseed yield are indicated. (b) Negative log10 P-values for association of plant height in Sanya (Y axis) are plotted against SNP positions (X axis). Two loci (SiDFL1 and SiILR1) significantly associated with oilseed yield are indicated. (c) Pyramiding of desired alleles (at SiDOG1, SiIAA14, SiDFL1 and SiILR1) in sesame varieties. The varieties accumulated the desired alleles generally shows better yield performance. The bar indicates s.e. (d) Allele frequency changes from landraces to modern cultivars for all lead SNPs underlying flowering time and plant height. The loci for plant height showed to be selected more intensively than those for flowering time.

