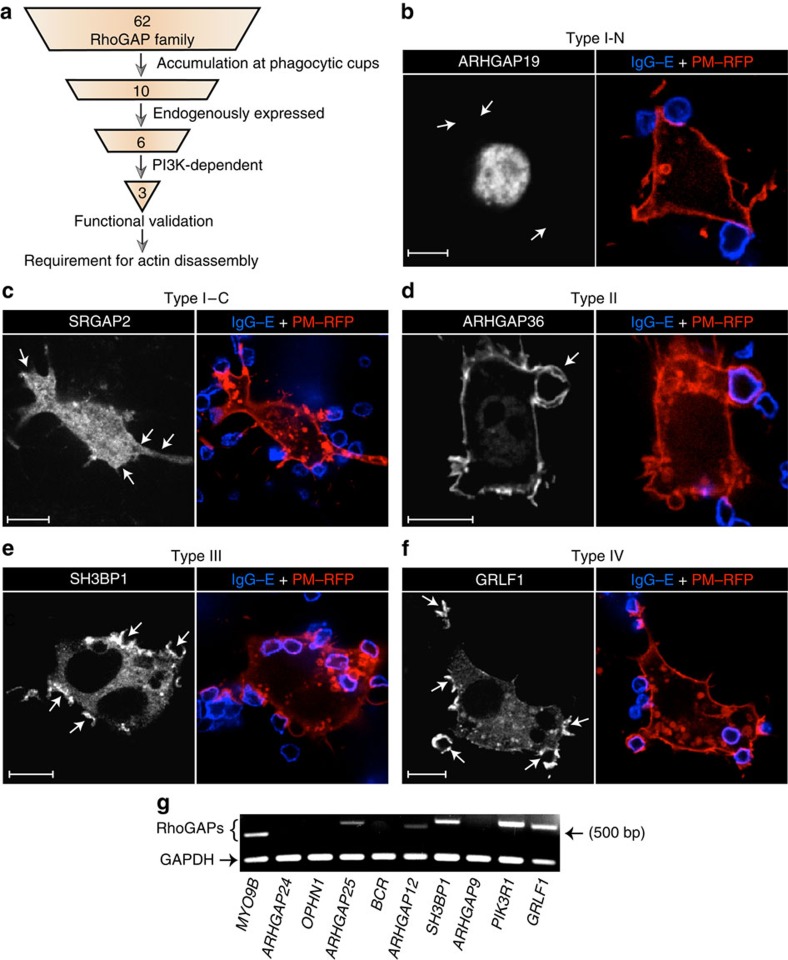
Figure 2. Screening for RhoGAPs responsible for orchestrating actin breakdown.
(a) Schematic outlining the experimental approach used in this study. We generated a collection of constructs comprising 62 members of the RhoGAP family conjugated to mCitrine. Each plasmid was independently transfected into RAW 264.7 macrophages, and the subcellular distribution of the encoded RhoGAP followed by confocal microscopy during phagocytosis. The extent of accumulation at phagocytic cups was assessed by ratiometric analysis relative to PM–RFP, a marker for bulk plasma membrane. The 10 RhoGAPs that most significantly accumulated at phagocytic cups were selected for further screening, consisting of assessing endogenous expression by RT–PCR and dependency of recruitment on PI3K. The ability of the remaining candidates to function as RhoGAPs during phagocytosis was validated by overexpressing these proteins and quantifying phagocytic capacity. Lastly, gene silencing was used to determine whether the identified RhoGAPs were necessary for coordinating actin remodelling during phagocytosis. (b–f) Subcellular distribution of a selective subset of RhoGAPs during phagocytosis of IgG-coated erythrocytes (IgG–E). RAW 264.7 macrophages were co-transfected with constructs encoding mCitrine-tagged RhoGAPs plus the plasmalemmal marker PM–RFP. Each panel corresponds to a representative member of four identifiable RhoGAP types, as determined by their recruitment (or lack thereof) to sites of phagocytosis. RhoGAPs that failed to localize to sites of particle engagement and remained nuclear (b) or cytosolic (c) were assigned a type I–N and type I–C nomenclature, respectively. RhoGAPs that constitutively localized to the plasmalemma but did not accumulate at phagocytic cups (d) were designated as type II. In contrast, RhoGAPs that were initially cytosolic but translocated to phagocytic cups (e) were labelled as type III. Lastly, type IV RhoGAPs showed both a cytosolic and plasmalemmal distribution at rest but accumulated at phagocytic cups (f). Arrows point to sites of particle engagement. Scale bar, 10 μm. At least 20 cells were assessed for each RhoGAP in the collection. (g) Representative image of three independent RT–PCR assays, used to ascertain the endogenous expression levels of the 10 RhoGAPs that were most markedly recruited to phagocytic cups. GAPDH was used as a positive control.

