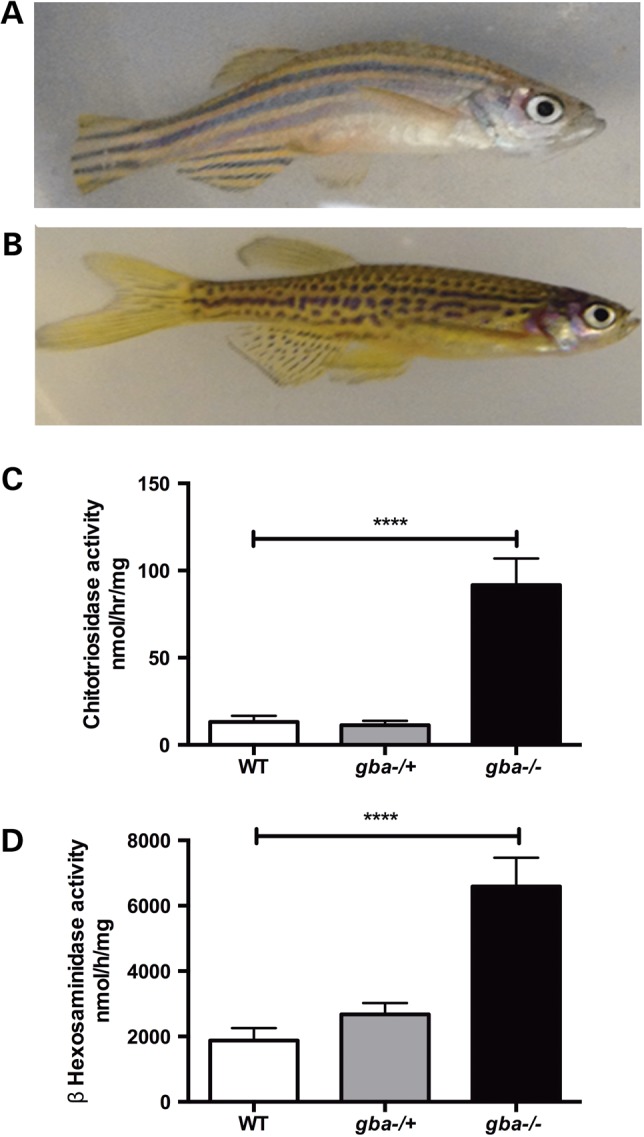
Figure 3.

Skeletal and biochemical indices of GCase deficiency. At 12 wpf gba1−/− (A) developed a curve to their spine compared with wild-type (WT) controls (B) in a similar manner to some conditional GBA1 KO mice (17). The difference in the stripe pattern of gba1−/− (A) and wild-type zebrafish (B) is due to the gba1+/− line being of mixed lineage with (wild-type) AB and (wild-type) TL genetic background. Classical Gaucher disease biomarkers were markedly elevated in gba1−/− brains at 12 wpf, with a 10-fold increase in chitotriosidase activity (P < 0.0001) (C) and a 4-fold increase in β-hexosaminidase activity (P < 0.0001) (D). No significant changes were detected in either assay in gba1+/− brains. ****P <0.0001.
