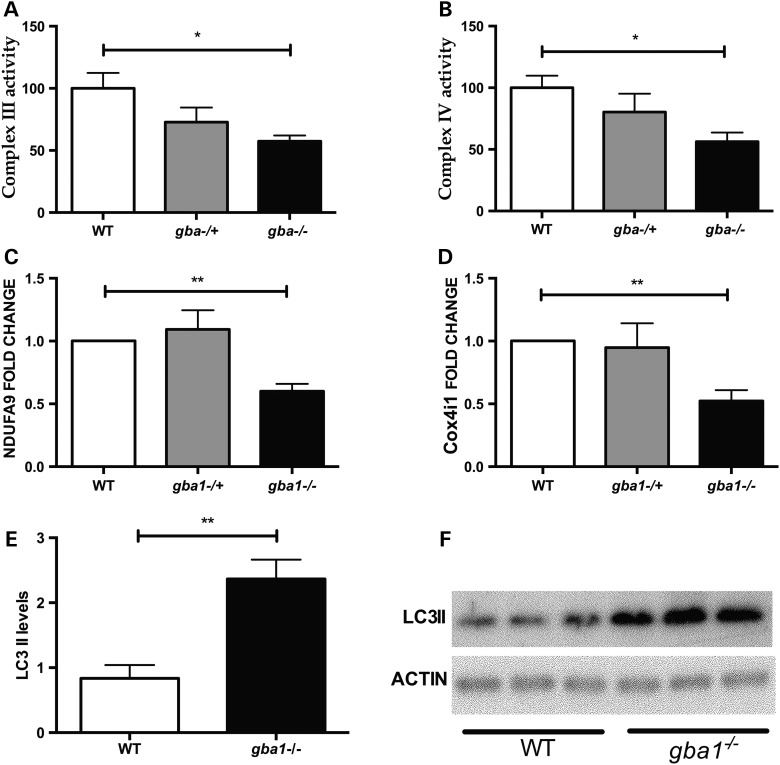
Figure 8.
Mitochondrial dysfunction and autophagy in gba1−/− zebrafish. There was a 50% decrease (P < 0.05) in complex III (A) and complex IV (B) activity in gba1−/− brains at 12 wpf. There was also a decrease in the protein levels of the complex I subunit NDUFA9 (C, P < 0.01) and the complex IV subunit Cox4i1 (D, P < 0.01). LC3-II was increased 2-fold in gba1−/− brains at 12 wpf compared with wild-type (WT) (E, P < 0.01). (F) A representative western blot of LC3-II protein levels in wild-type and gba1−/− zebrafish brains. *P < 0.05; **P < 0.01.

