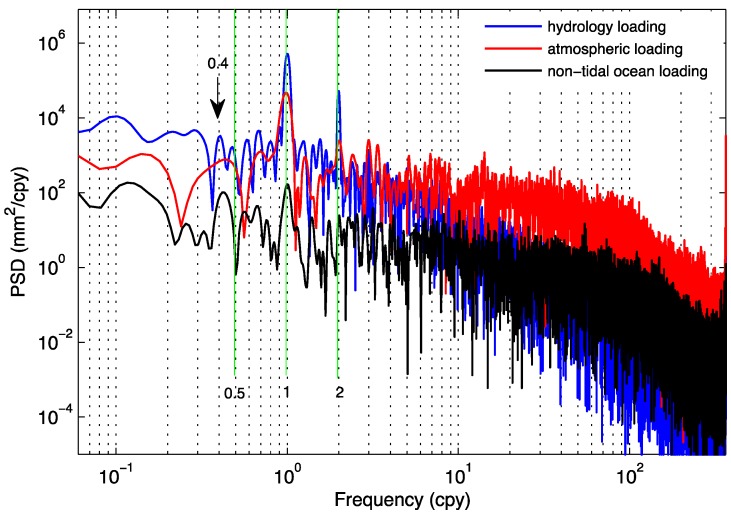
Figure 7.
Power spectra density (PSD) of hydrology loading, atmosphere pressure loading and non-tidal ocean loading at LHAZ region corresponding to LHAZ GPS station in China. Blue, red and black curves denote the PSDs of the hydrology loading, atmosphere pressure loading, and non-tidal ocean loading, respectively.

