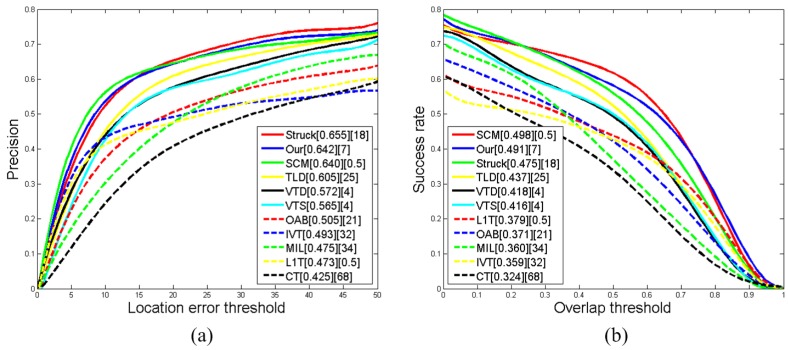
Figure 6.
The performance score for each tracker is shown in the legend. (a) The precision plots of CLE, and the score is the precision at the threshold of 20 pixels; (b) the success plots of VOR, and the score is the AUC value. The second square bracket indicates the corresponding Fps of each tracker.

