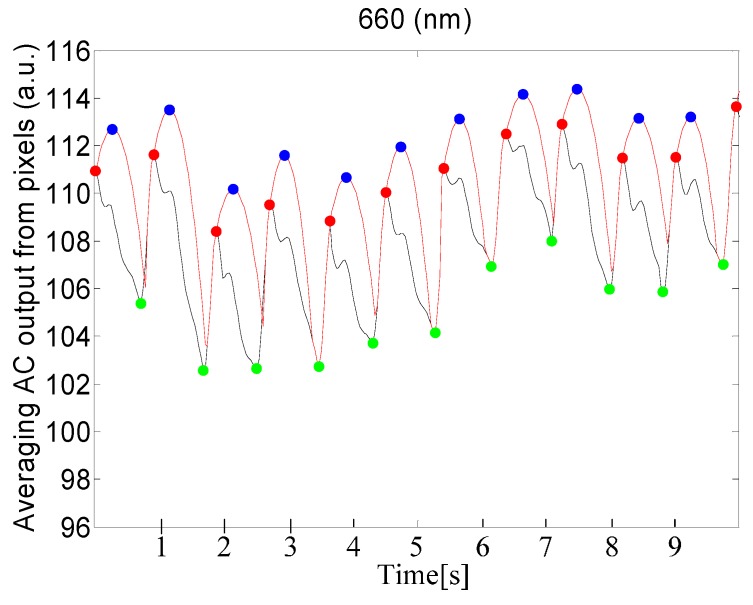
Figure 7.
Results of detection of maxima and minima for PPGi signal, using a 660 nm source of light. The red curve represents the adaptive quadratic curve generated by the proposed method. The blue points represent the maxima of the quadratic curve. The red points represent the maxima of the PPGi signal. The green points represent the minima in the PPGi signal. All of these points were determined using the proposed PPGi method.

