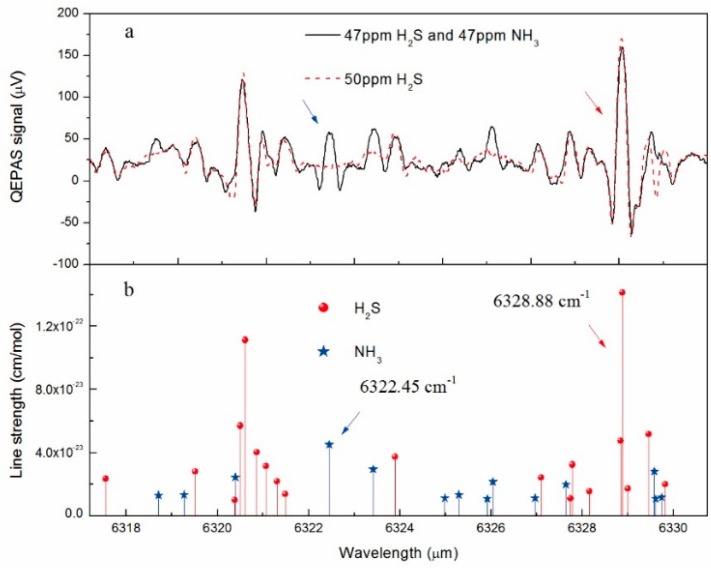
Figure 2.
(a): 2f QEPAS signal when the laser temperature is scanned with 1250 mW laser power at atmospheric pressure and room temperature. The spectrum plotted by a black line is from 47 ppm H2S:47 ppm NH3:N2; the spectrum plotted by a red dash line is from 50 ppm H2S:N2; (b): Line strengths of the H2S and NH3 transitions, as reported in the HITRAN database, within the frequency span of Figure 2a.

