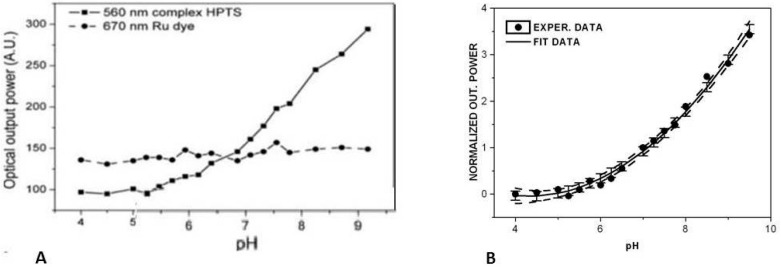
Figure 7.
Calibration curves of the V-taper sensing probe in response to pH changes: (A) optical responses of the HPTS transducer and dichloro-tris-(1,10-phenanthroline)ruthenium (II) hydrate to pH; (B) calibration curve (including the upper and lower confidence limit dash lines [47,75]. Reproduced from [47] with the permission of CTU editors.

