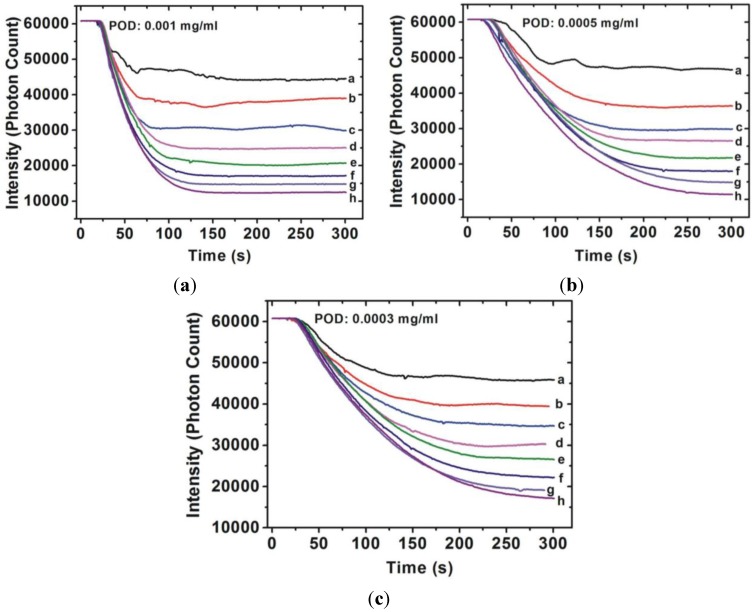
Figure 3.
Transmittance-time response behavior of various H2O2 concentrations (a: 0.0001%; b: 0.00015%; c: 0.0002%; d: 0.00025; e: 0.0003%; f: 0.00035; g: 0.0004; h: 0.00045%) measured by the sensor with various POD concentrations ((a) 0.001 mg/mL; (b) 0.0005 mg/mL; and (c) 0.0003 mg/mL) at monitored wavelengths of 510 nm.

