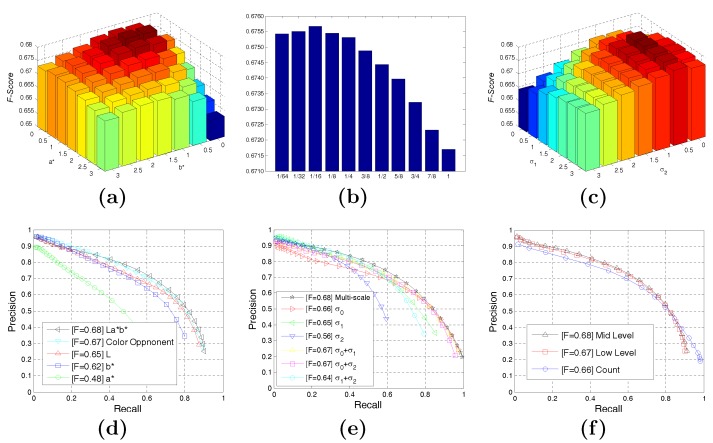
Figure 5.
Performance tests with the parameters in our model. (a) Performance with the changing of low-level cue parameters; (b) performance with the changing of mid-level cue parameters; (c) performance with the changing of the relative contribution of each scale; (d) P-R curves of -based and color opponent-based methods; (e) P-R curves of each scale; (f) P-R curves of the performance of each part in our algorithm.

