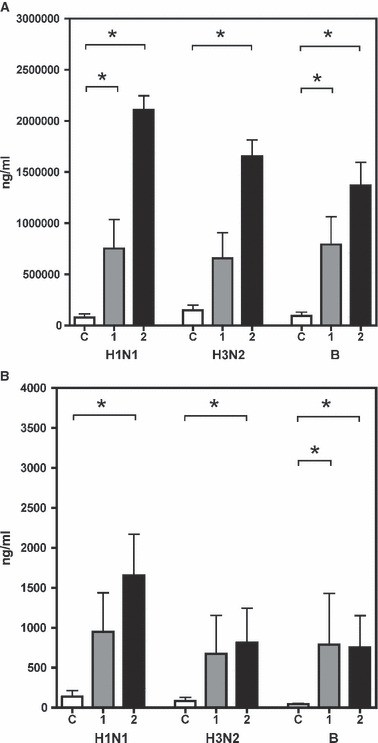
Figure 2.

The concentration (ng/ml, indicated on the left) of influenza virus‐specific antibodies to the three vaccine viruses (H1N1, H3N2 and B strains, stated below) from study II (A) in serum and (B) in saliva. The bars show the mean (+SEM) concentrations at operation for controls (C, open bars), and for patients operated 1 week (1, grey bars) or 2 weeks (2, black bars) after vaccination. *Significant difference between pre‐ and post‐vaccination samples (P < 0.05, by Mann–Whitney test).
