
Figure 2.
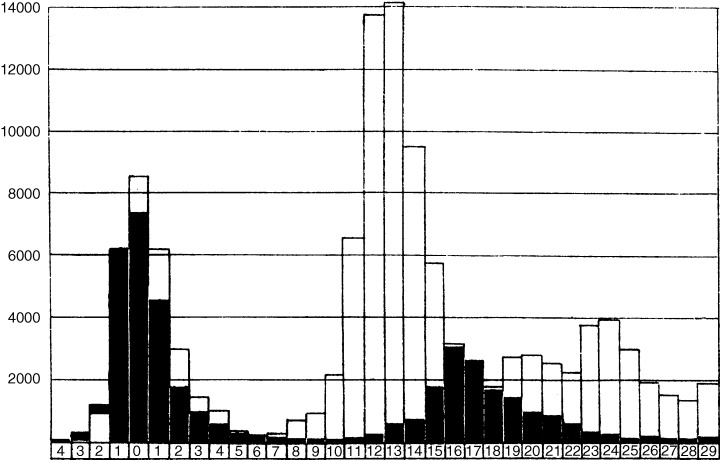
Incidence of influenza cases in Royal Air Force camps (black columns) and the city of Copenhagen (white columns) during the 1918–1919 pandemic. 19 Time‐line units are in weeks measured from the maximum of the initial peak. Both curves display multiple waves, consistent with hypotheses of waning immunity and/or antigenic drift. De‐mobilization at the conclusion of World War I could have prevented the third wave, visible for Copenhagen, from being registered in the Air Force camps.