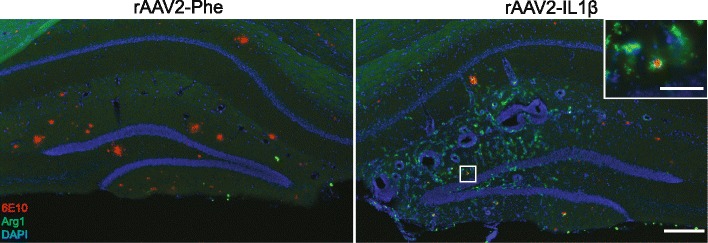
Fig. 1.

Arg1 microglia are induced after rAAV2-IL1β injection. Representative hippocampal images 4 weeks after rAAV2-IL1β injection. Images were acquired from the same histological section and show that induction of Arg1+ cells (green) was limited to the inflamed hemisphere (rAAV2-IL1β). Inset shows Arg1+ cells surrounding 6E10+ Aβ plaques (red). Sections were counterstained with DAPI (blue) to show cell nuclei. Scale bar represents 200 μm in low-power images and 50 μm in high-power inset
