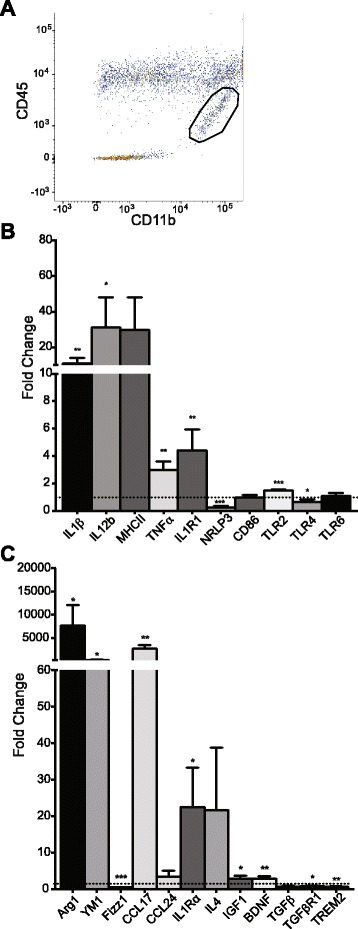
Fig. 3.

Microglial phenotype genetic profile. a Representative image demonstrating the gating strategy used to isolate CD11b+ CD45low microglia. Circled area represents sorted microglia population. qRT-PCR analysis of inflammatory (b) and anti-inflammatory (c) gene expression for hippocampal CD11b+ CD45low microglia during sustained inflammation. Values are normalized to the control, rAAV2-Phe-injected hemisphere, represented by the dotted line. Data was analyzed with Student’s t test. Data displayed as mean ± SEM, n = 4–5 animals. *p < 0.05, **p < 0.005, ***p < 0.0001
