Fig. 6.

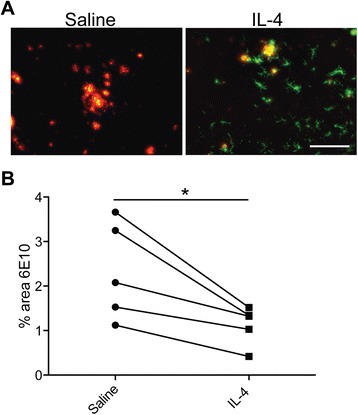
IL-4 injection leads to Arg1+ cell induction and Aβ plaque reduction. a Representative images of Arg1+ cells (green) surrounding 6E10 Aβ plaques (red) 5 days after intrahippocampal IL-4 injection (100 ng). Scale bar represents 100 μm. b Quantitative dot plot analysis of the percent area occupied by 6E10 in the saline vs. IL-4-injected sides of five mice. Data was analyzed using paired Student’s t test, *p < 0.05
