
Figure 1.
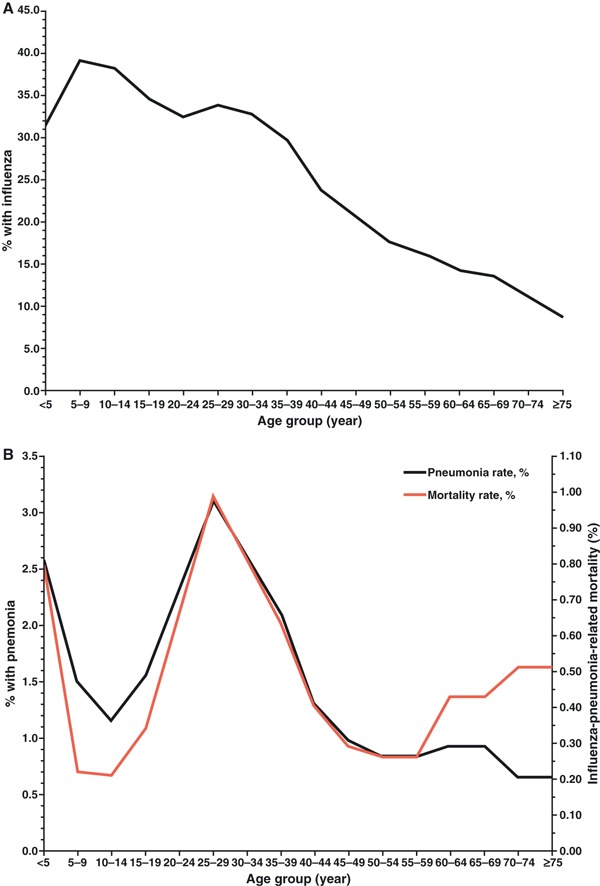
Panel (A) shows the estimated age group‐specific influenza case rates and panel (B) shows the estimated age group‐specific pneumonia rates and mortality rates based on household surveys conducted in 10 US communities [from figure 5 in Ref. (24)].