
Figure 3.
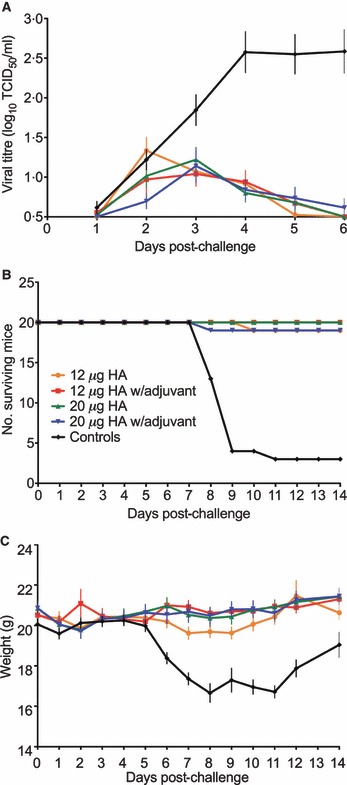
Protective efficacy of the H7N1 split virus vaccine in mice. (A) The viral shedding in the nasal washes. The mean viral titres (TCID50/ml ± SEM) are presented for each group. The lower limit of detection was 100·5 TCID50/ml. (B) The number of mice surviving viral challenge from each group of 20 animals. (C) Weight loss in challenged animals. The data is presented as mean weight loss (grams) ± SEM. Mice were examined for day 6 (viral shedding) or 14 days (death and weight loss) after challenge and the data is presented for each vaccine group as follows: 12 μg (orange), adjuvanted 12 μg (red), 20 μg (green), adjuvanted 20 μg (blue) and unvaccinated controls (black). Statistical comparisons between the groups for virus recovery were based on the mean virus shedding over 6 days or for weight loss on the mean weight over 14 days for each animal and an analysis of variance was carried out using a multiple comparisons approach, with a Bonferroni corrections.