
Figure 4.
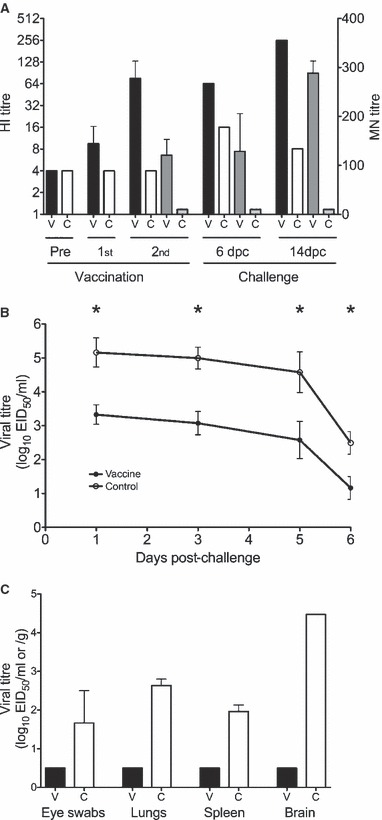
The protective efficacy of the vaccine in ferrets. Groups of four ferrets were vaccinated with two doses of 24 μg HA aluminium adjuvanted H7N1 vaccine or saline (controls) and challenged 3 weeks after the second dose with the highly pathogenic H7N1 virus. Two animals from each group were killed at 6 days post‐challenge and the remaining two at 14 days post‐challenge. (A) The serum HI and MN antibody responses measured pre‐ and 21 days after the first (1st) and second (2nd) doses of vaccine (n = 4 per group) and at 6 and 14 days post‐challenge (dpc) (2 ferrets per group). The HI data is presented as the geometric mean titre and 95% confidence interval of vaccinated (filled black bars) or control (open white bars) animals. The MN titres are presented as the mean ± SEM of vaccinated (dark grey bars) or control (light grey bars) animals after the second vaccination and at 6 and 14 days post‐challenge. For calculation purposes, HI and MN titres <8 and 20, respectively, were assigned values of 4 and 10. (B) The viral shedding in the nasal wash measured from four animals per group at 1, 3 and 5 days post‐challenge, and two animals per group at day 6. The data is presented as mean are presented as the mean ± SEM by filled circles and the control ferrets by open circles. A mixed linear regression model was used to test the viral recovery from nasal washes and the vaccinated ferrets had significantly lower viral shedding than control animals (*P < 0·05). (C) Viral recovery from the eye, spleen, lung and brain detected 6 days after viral challenge of vaccinated (filled black bars) and controls (open bars). The log viral titres were determined in the nasal wash (log EID50/ml) or in the tissues (log EID50 per ml eye swab fluid or per gram of tissue) and are presented as the mean ± SEM. The lower limit of detection was 100·5 EID50/ml for virus recovery from nasal washes, tissues and eye swabs.