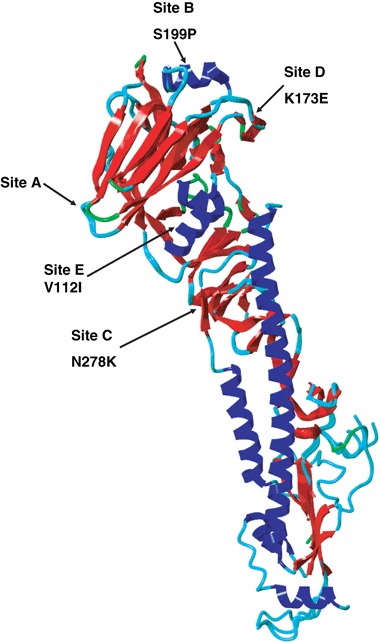
Figure 4.

Three dimensional model (ribbon view) showing the aa changes in the HA1 molecule observed in the 2006 Kenyan isolates: V112I, K173E, S199P, and N278K. These occupy the immunodominant sites B (Pro 199), C (Lys 278), D (Pro199), and E (Glu 173).25 Figure generated and visualized using YASARA (http://www.yasara.org) and PovRay (http://www.povray.org).
