
Figure 8.
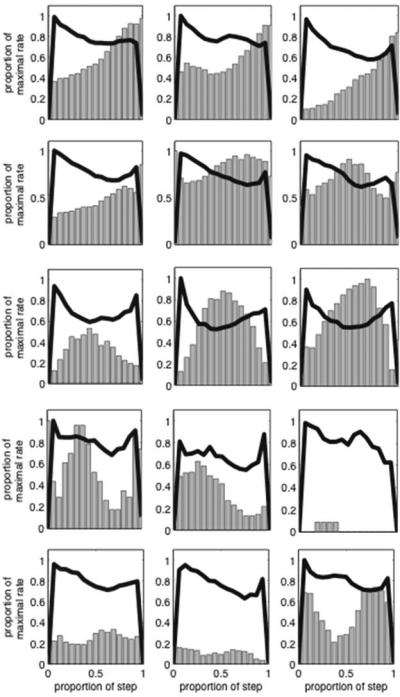
Heterogeneous patterns of firing rate changes in medial agranular cortex neurons during the high nosepoke occupancy “In” state, on probe trials in the mixed 10s/20s peak procedure Different neurons are shown on different rows, and different trial types are shown in different columns, as in Figure 7. To account for trial by trial variability in the length of the “In” state, the figures are binned using varying bin widths, that are 1/15 the width of the “In” state on each trial. Firing rates are shown as vertical bars, and occupancy in the nosepoke aperture is plotted as a thick black line. Firing rates and nosepoke occupancy within the “In” state have been smoothed with a 5-s running mean for presentation and were normalized by the maximum rate across trial types. The lack of stationarity in nose-poke occupancy was accounted for by using the time-varying occupancy as a covariate in the quantitative analysis. Figure from Matell,M.S. Shea-Brown, E., Gooch, C., Wilson, A.G., & Rinzel, J., A heterogeneous population code for elapsed time in rat medial agranular cortex. Behavioral Neuroscience. 125(1), 54-73, APA, with permission.